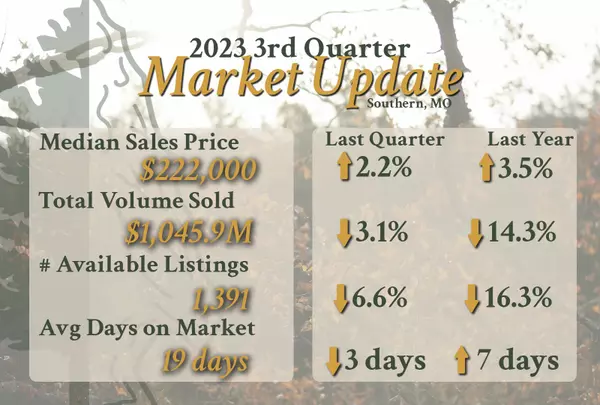
2023 Third Quarter Market Update
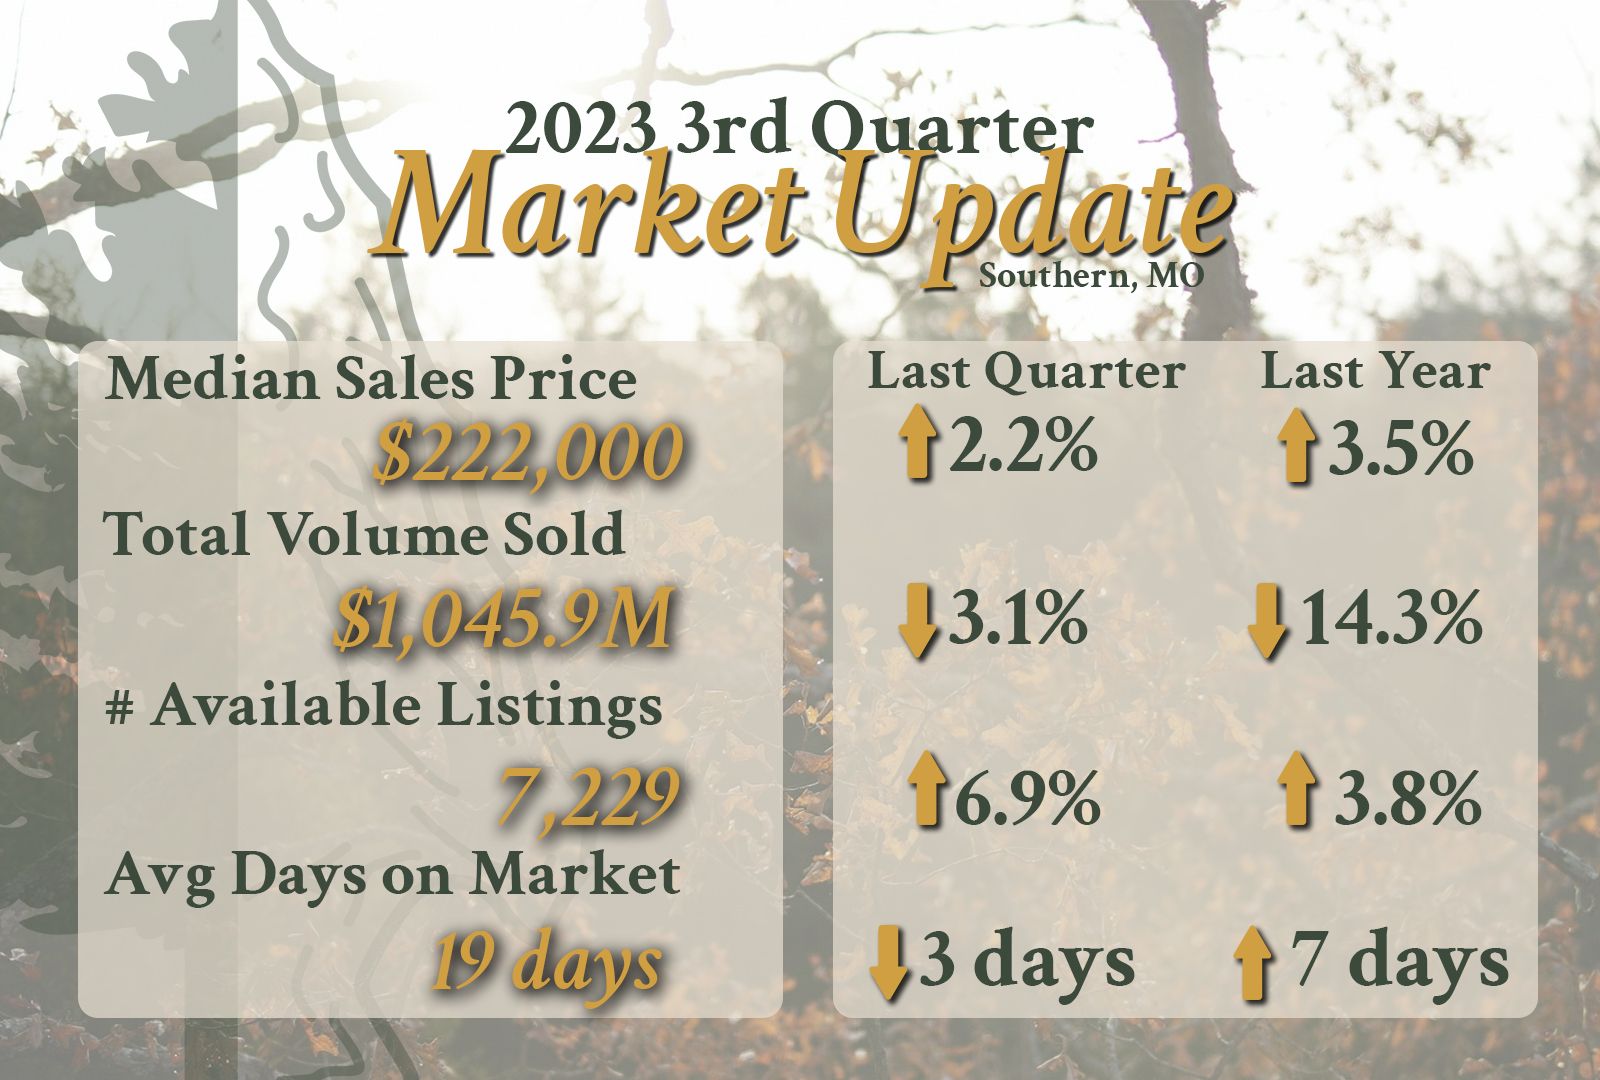
Overview Summary
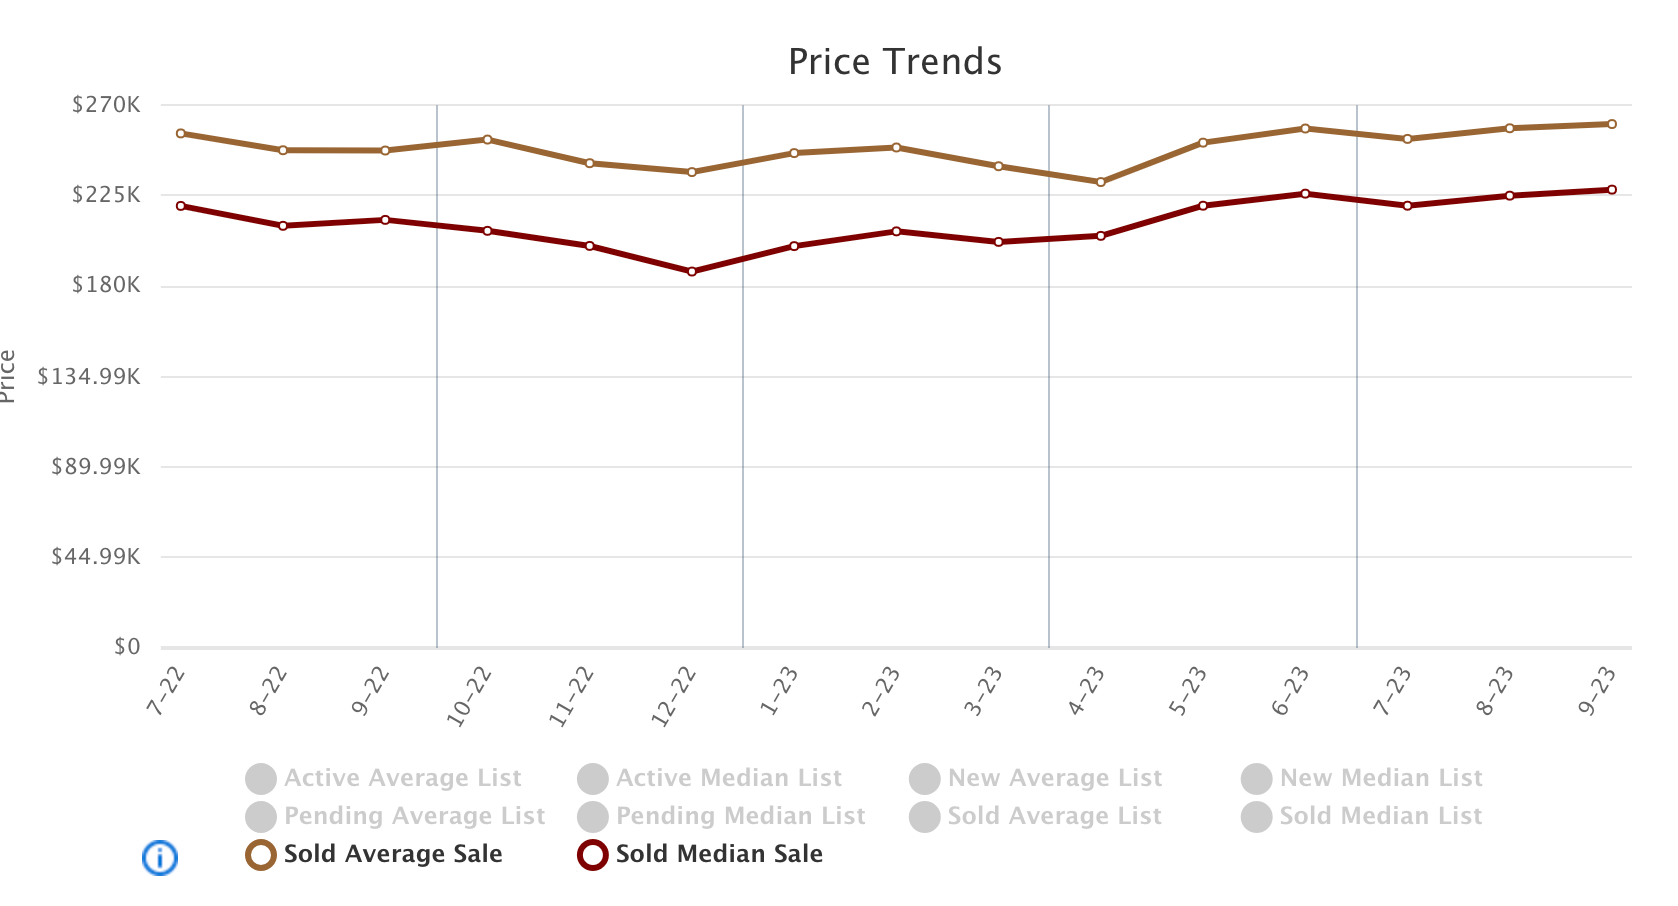
Price Trends
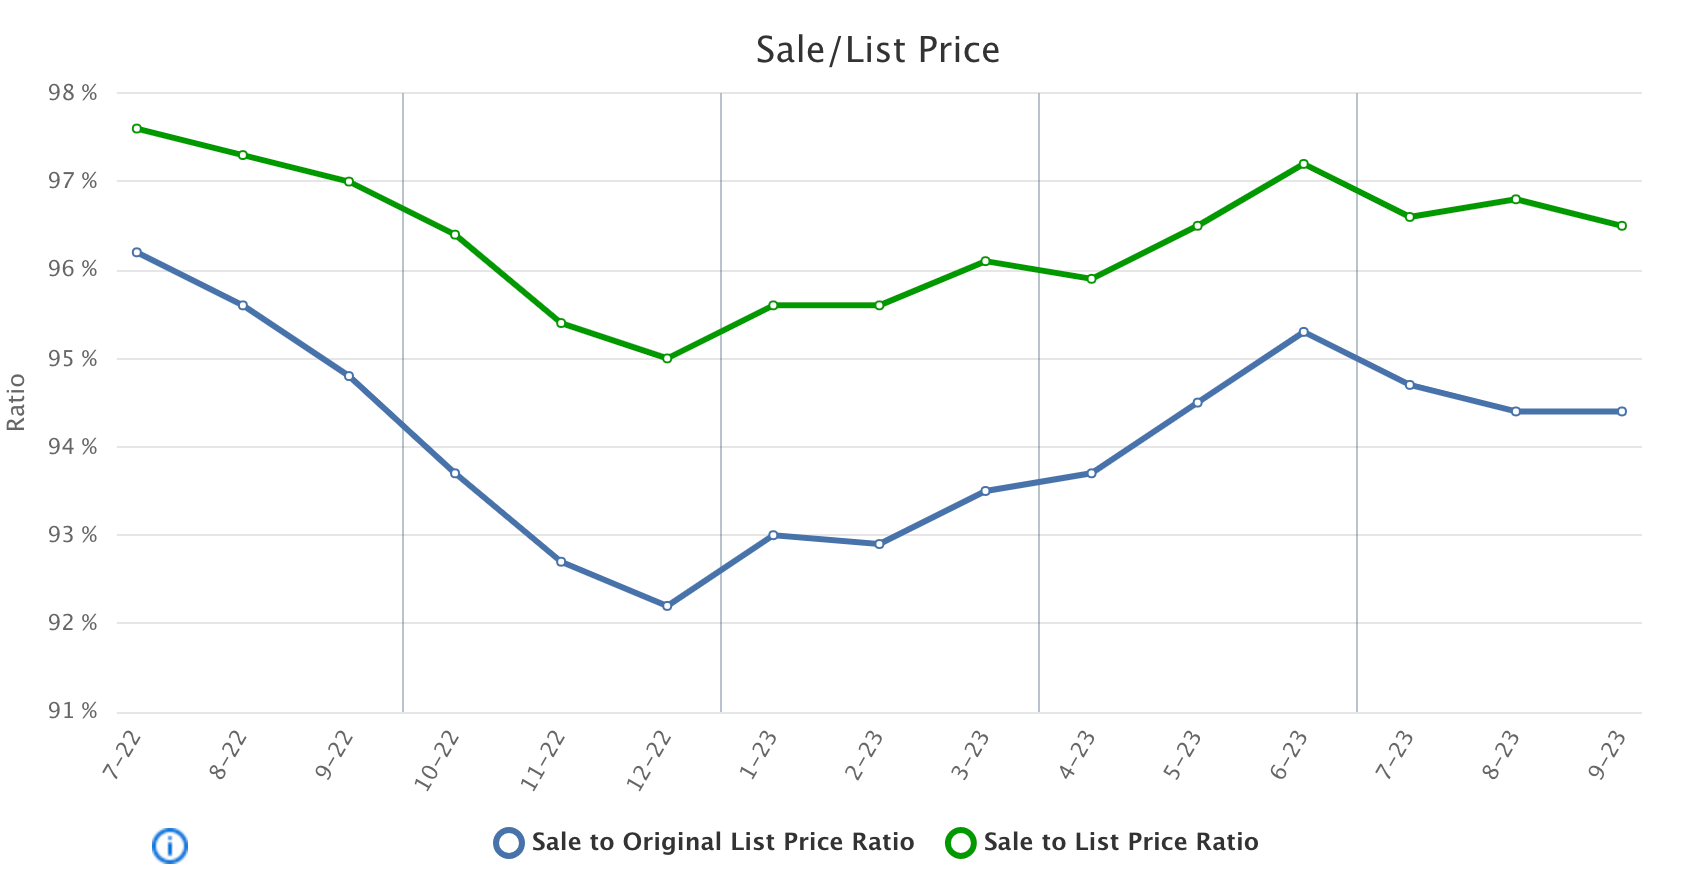
Sale/List Ratio
Below, you can compare the Original and Current List Price to actual Sale Price Ratios. This shows that most listings are reducing mid listing period before going under contract. During the COVID rush, these numbers exceed 100%. We are finally leveling out and sellers are having to adjust expectations. The time for pie in the sky prices is through. Sale prices have been driven up thanks to that time period, low inventory, and still level demand, but the rate at which that increase happened has drastically slowed and leveled out. You'll notice that the ever so slight price drop in the graph above correlates to the reduced sale/list price ratio timeline in the graph below.
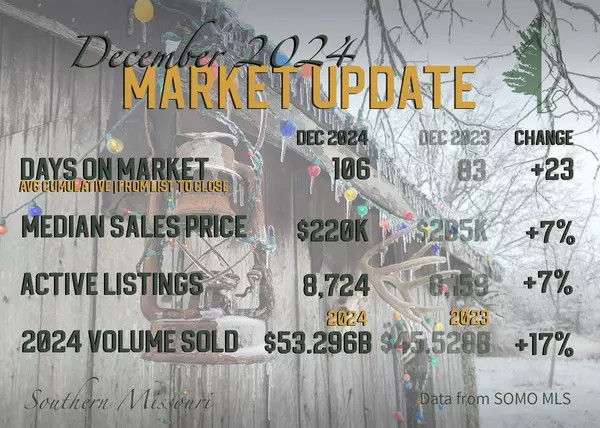
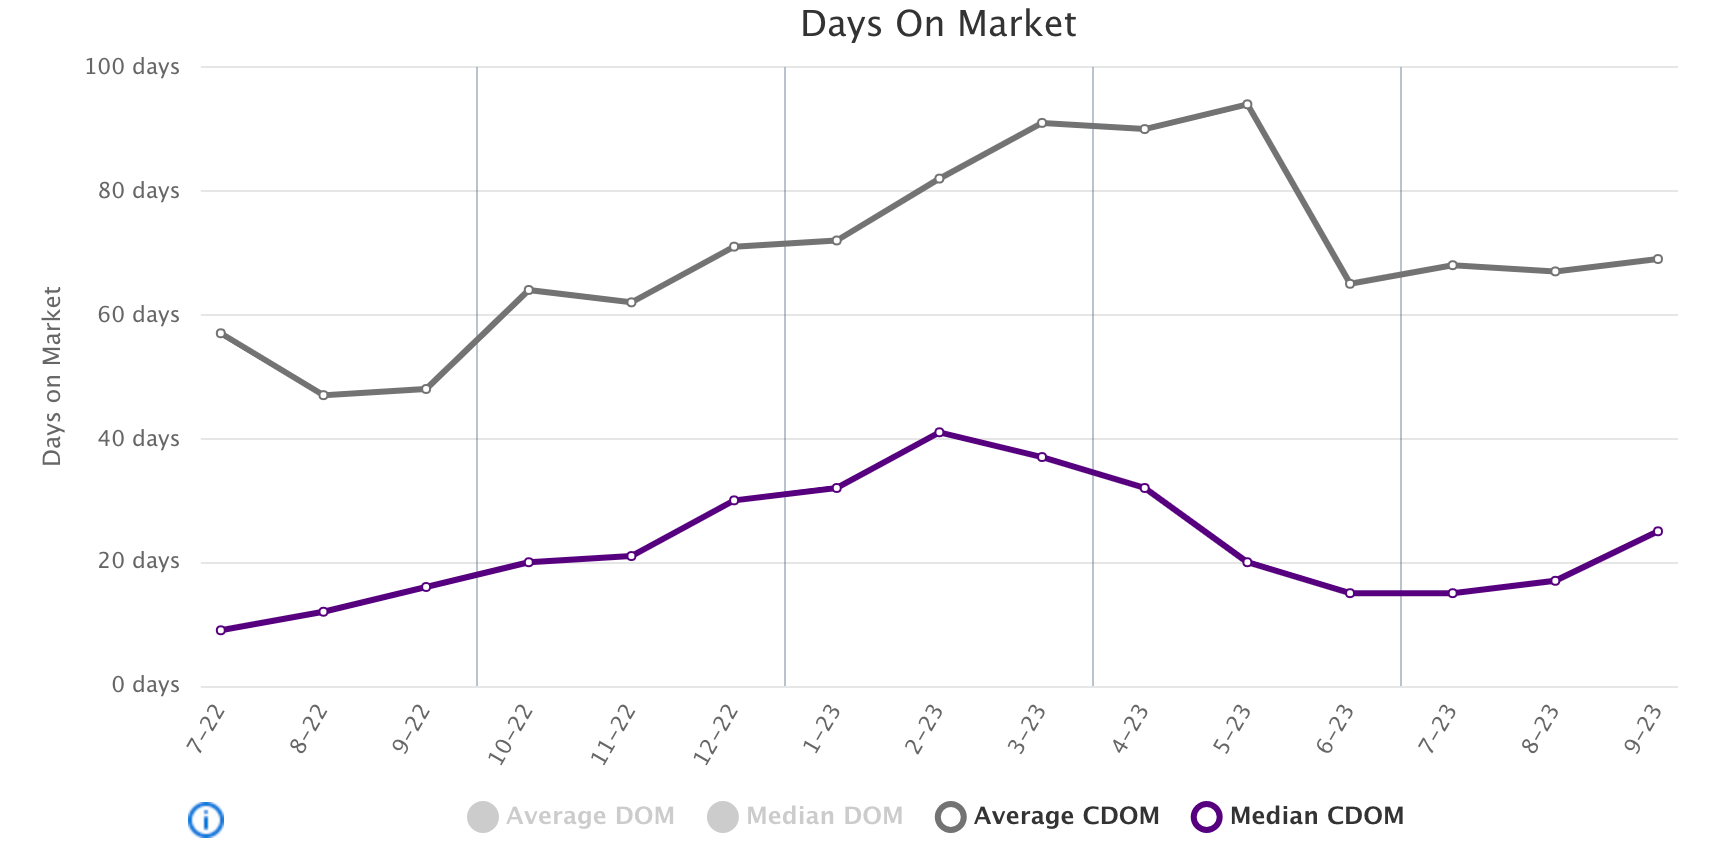
Days on Market
Our days on the market really began to climb Q3 2022 and began to fall Q2 2023. Q3 2023, we are starting to see another climb.
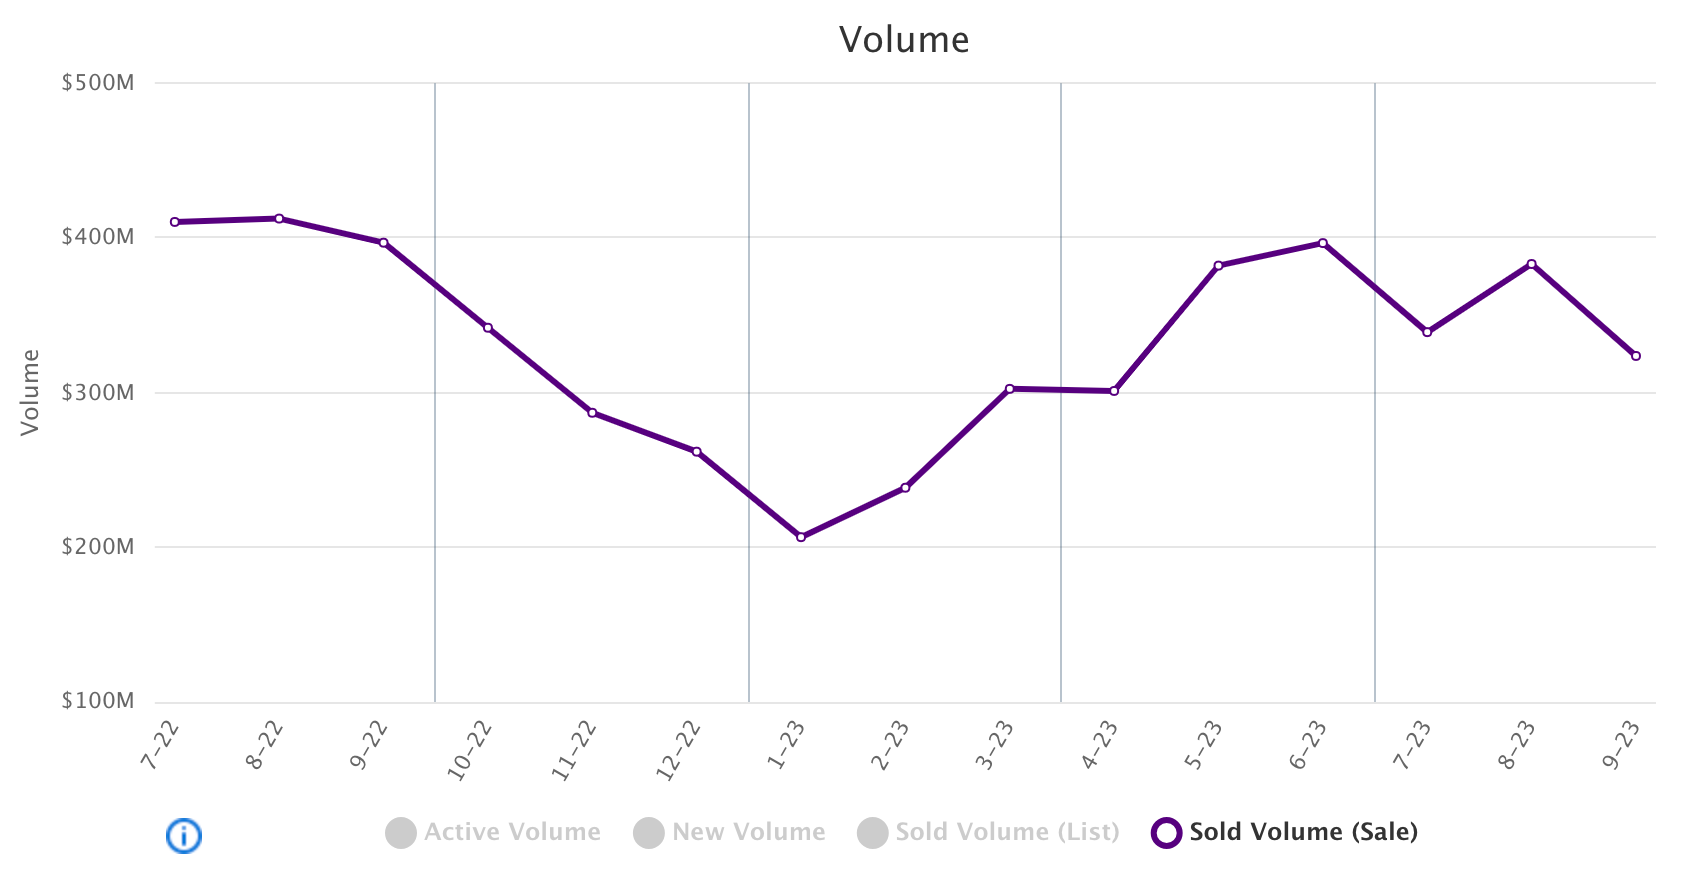
Sales Volume
By now, you'll notice the negative trend in the 4th quarter of 2022 and the improvement in the 31st quarter of 2023. The sales volume is no different. Q4 2022 took a large dive and began recovering in the first and second quarter of 2023. The volume isn't quite where it was a year ago, down 14.3% from Q3 2022 to Q3 2023.
Categories
Recent Posts