2023 Year End Market Update - Southern MO
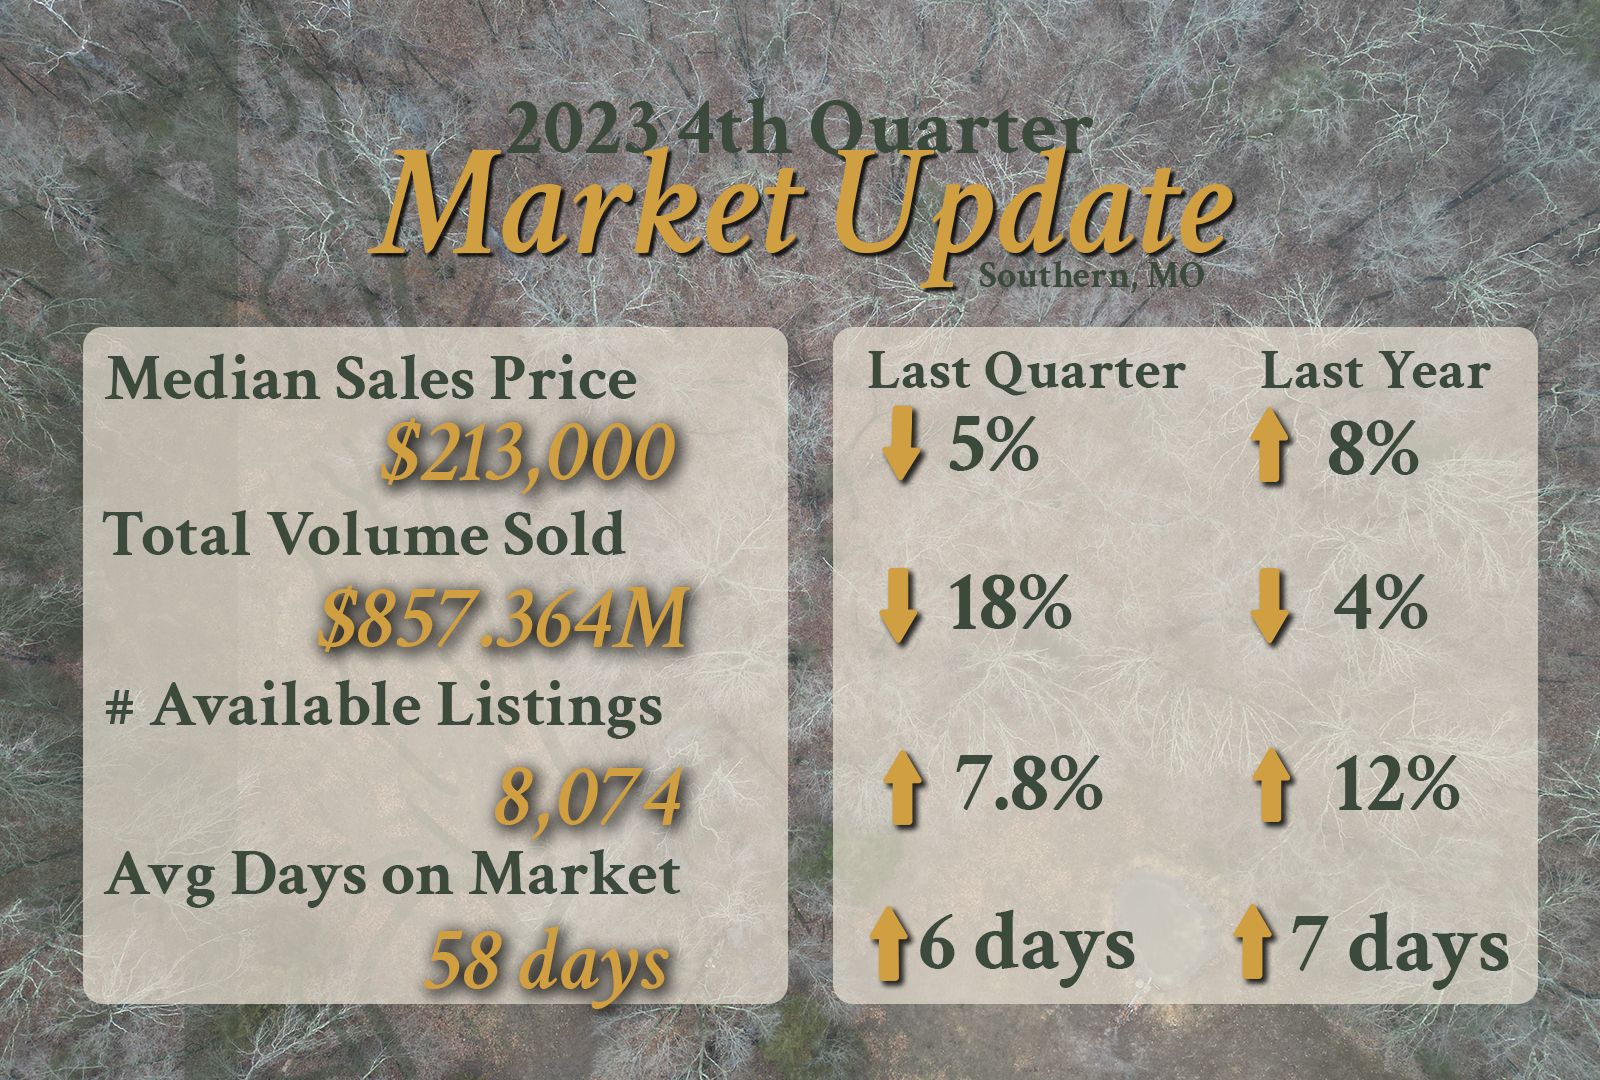
Southern Missouri 2023 Year End Market Review
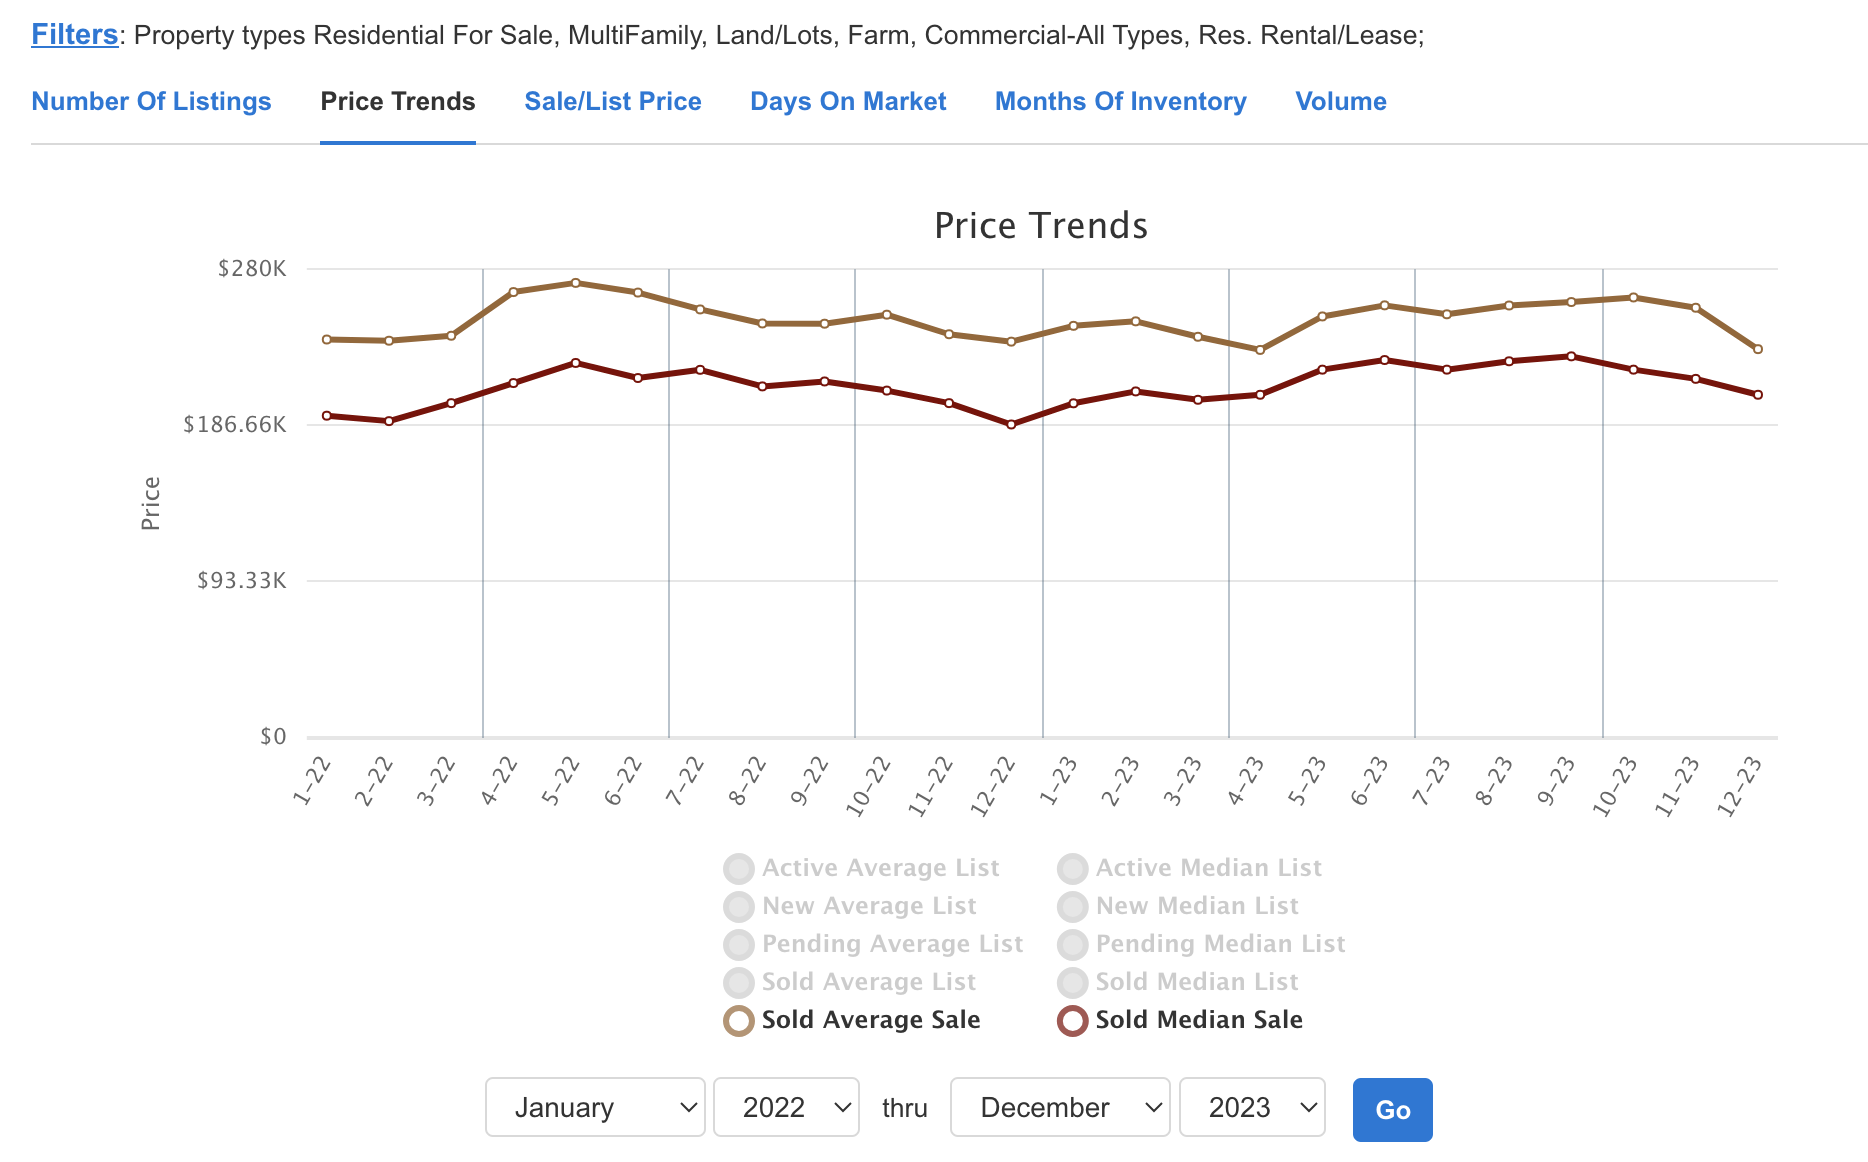
Price Trends
When discussing Price Trends, I am comparing Average or Median Sale Price per Property Sold. All property types... every house, commercial property, farm, or vacant land lot is averaged or median is taken to come up with the sale price trends used below.
Year over Year Comparison
Quarterly Comparison
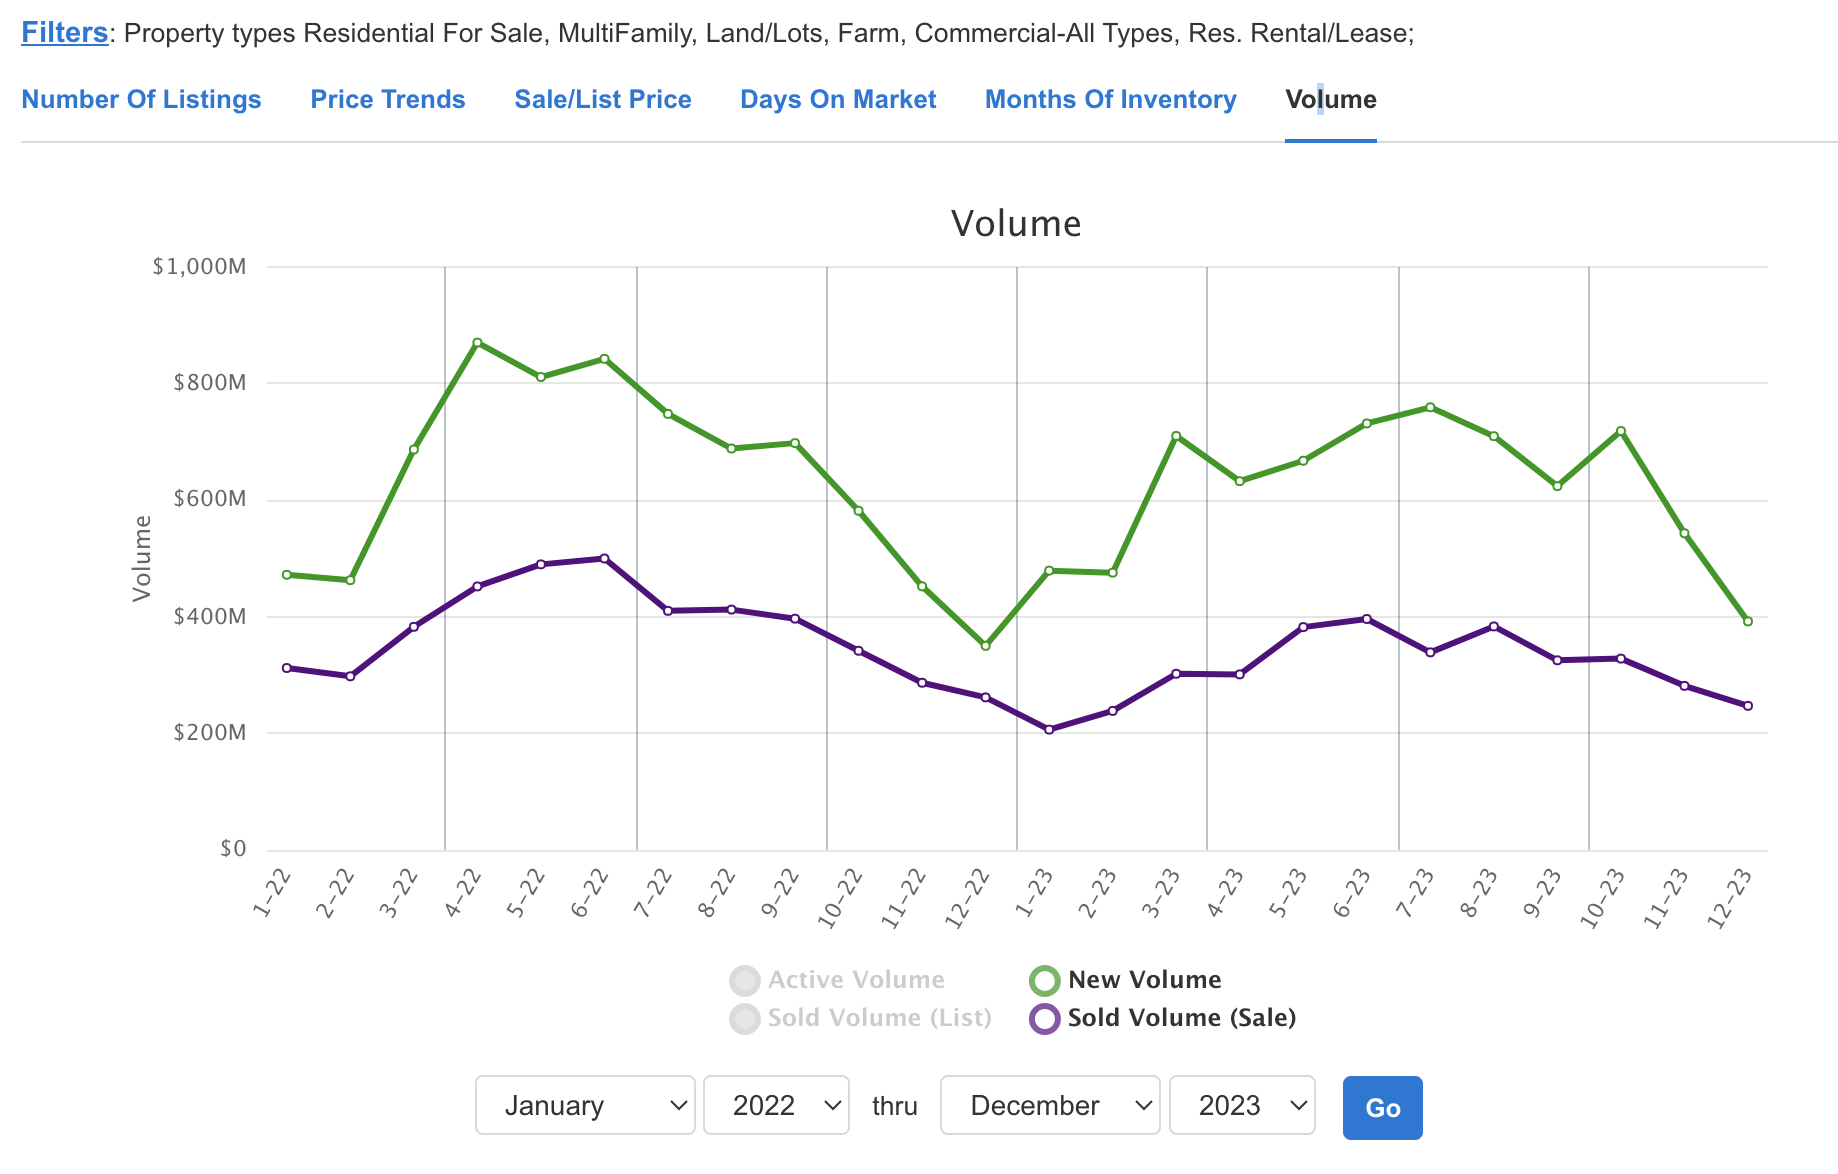
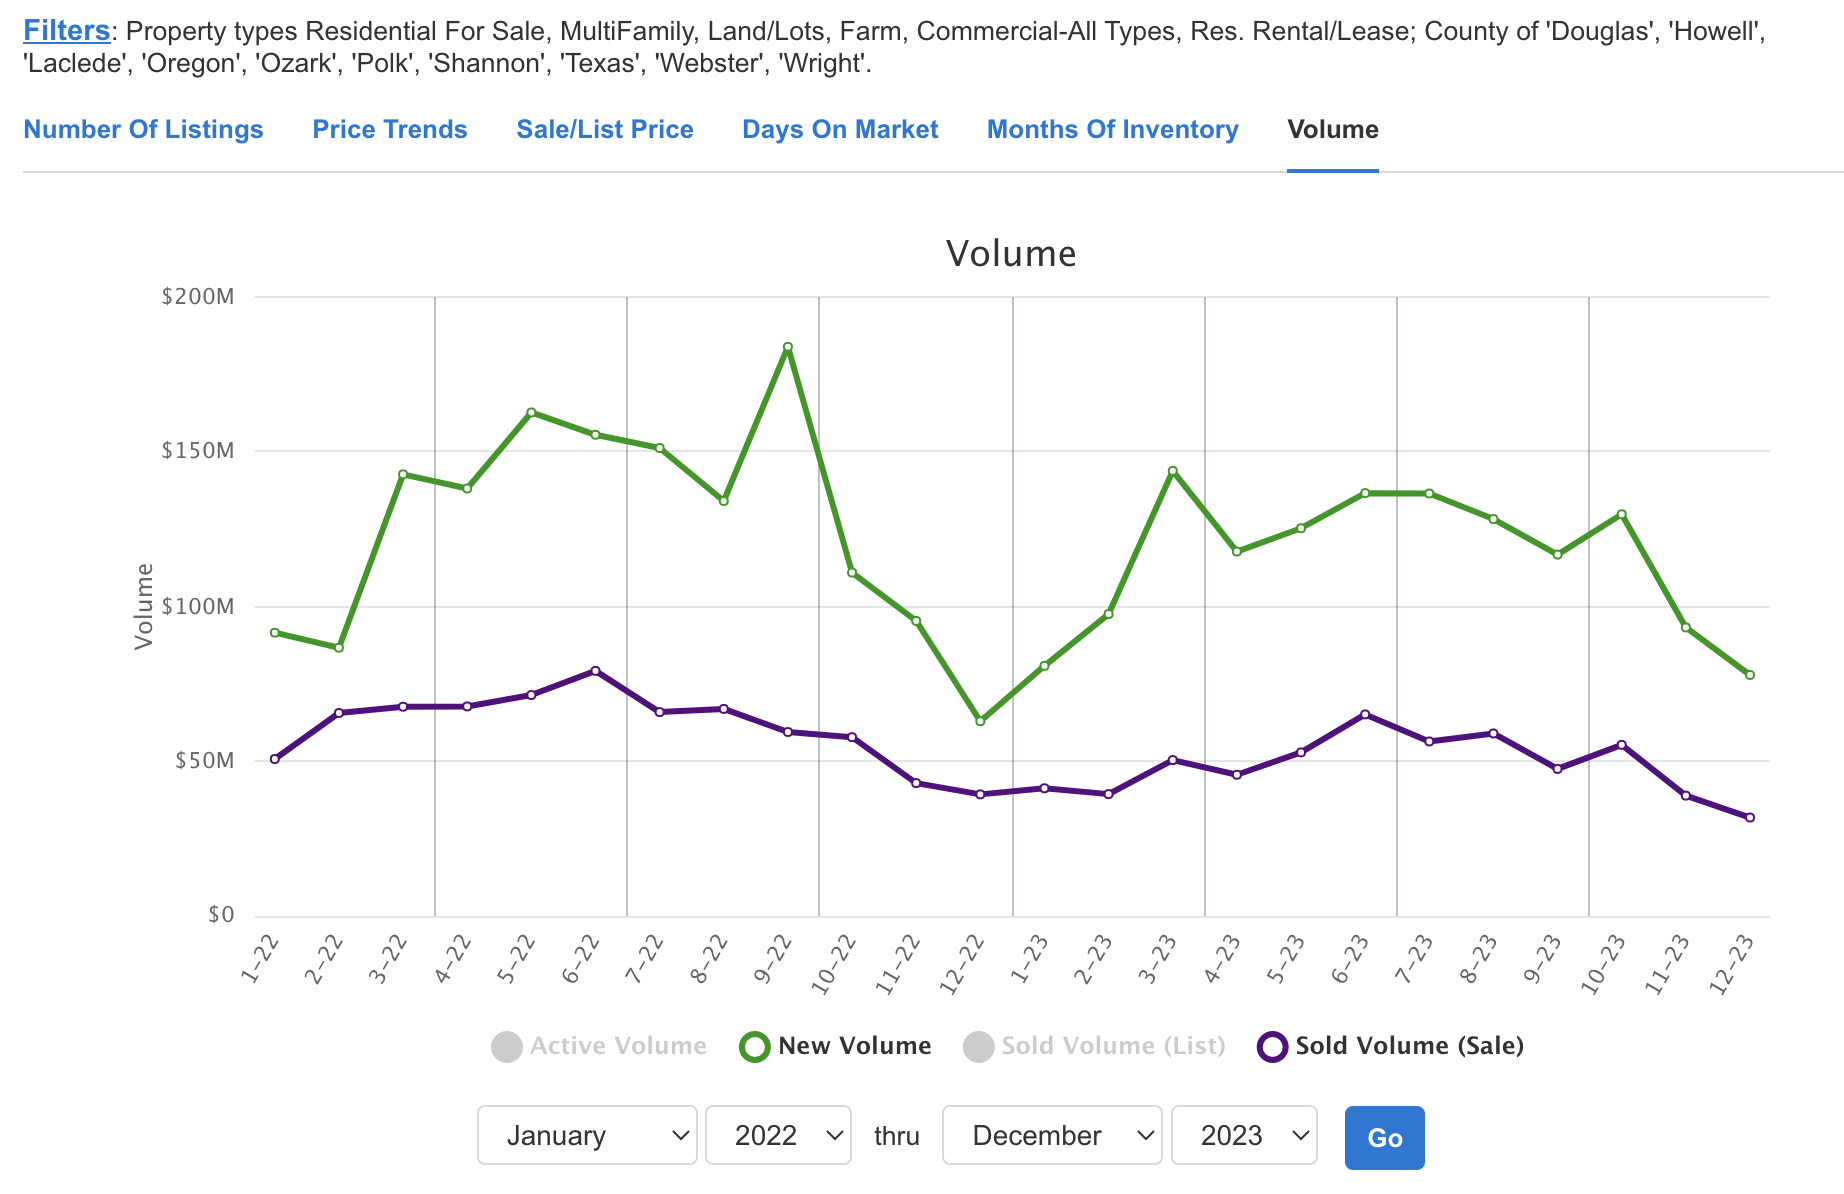
Volume Sold
When I discuss volume, I am referenceing the total amount of dollars of sold property. It doesn't account how many or quantity of properties, just $$ exchanged. Sales volume follows the seasonal ebbs and flows as well, hence the dips late in the year and early the following year in the graph below
Year over Year Comparison
Quarterly Comparison
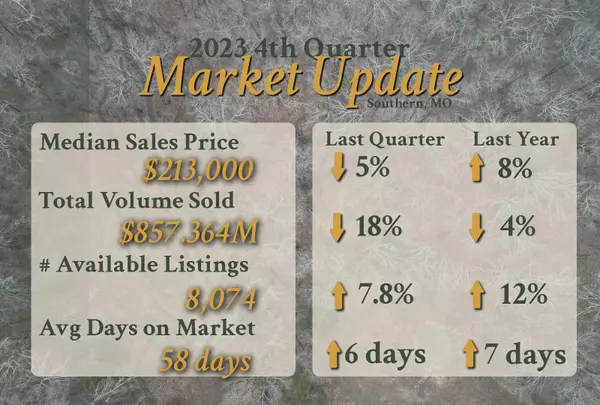
In 2023, 4th Quarter was down by 18% in comparison to the 3rd Quarter. In 2022, there was a larger 27% drop in volume between the 2 quarters.
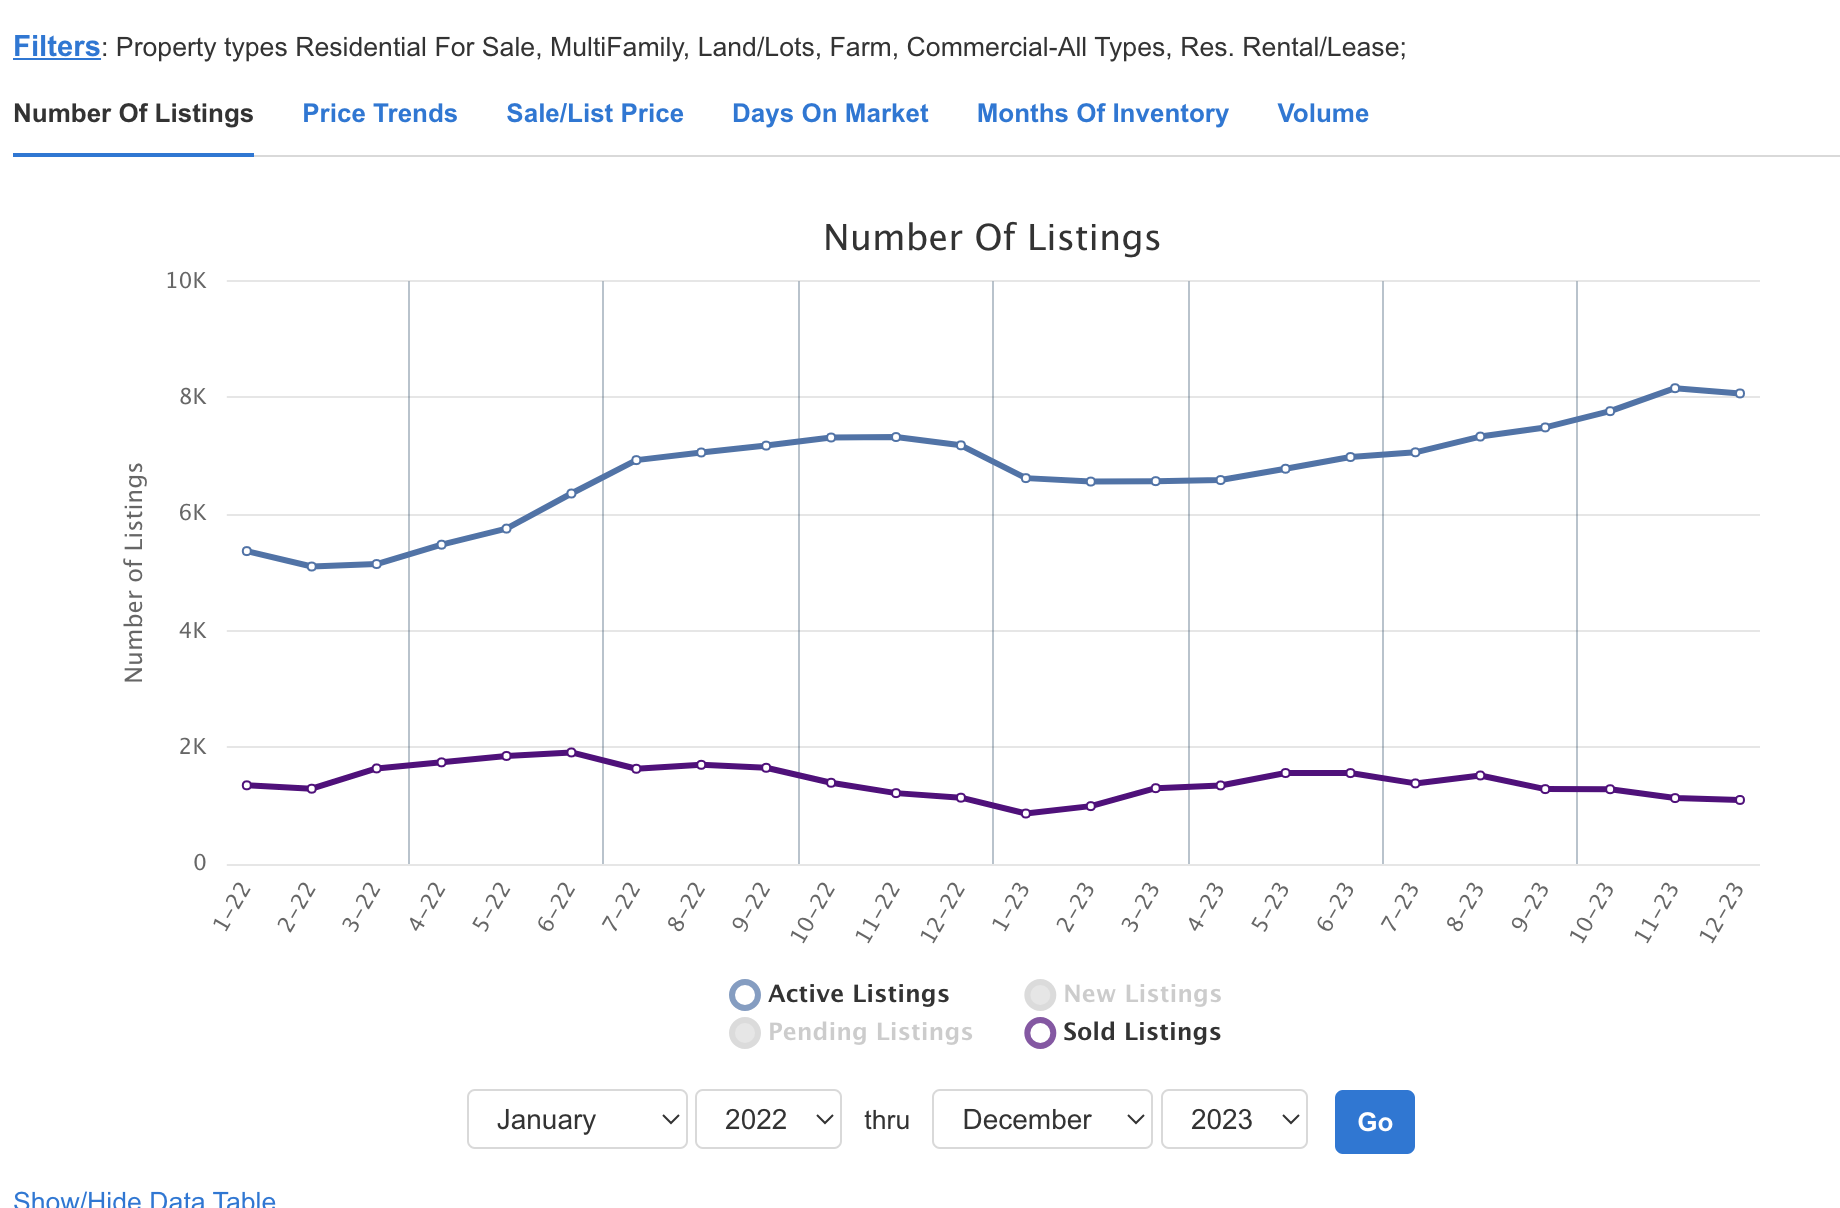
Inventory
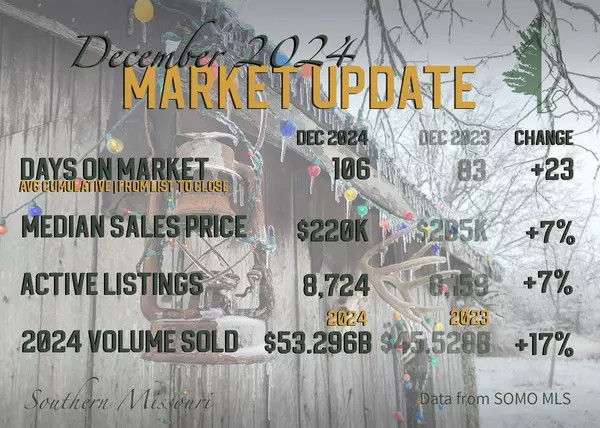
The quantity of listings has increased. January 2022 started with 5,370 listings on the entire MLS (including Springfield and surrounding area). By the end of 2022 we reached 7,180 active listings. At December 2023, we had 8,070 listings available. That's a 12.4% increase in NUMBER of listings available over the entire MLS and 14.9% increase in available volume from the end of 2022 to end of 2023 (average list price is up).
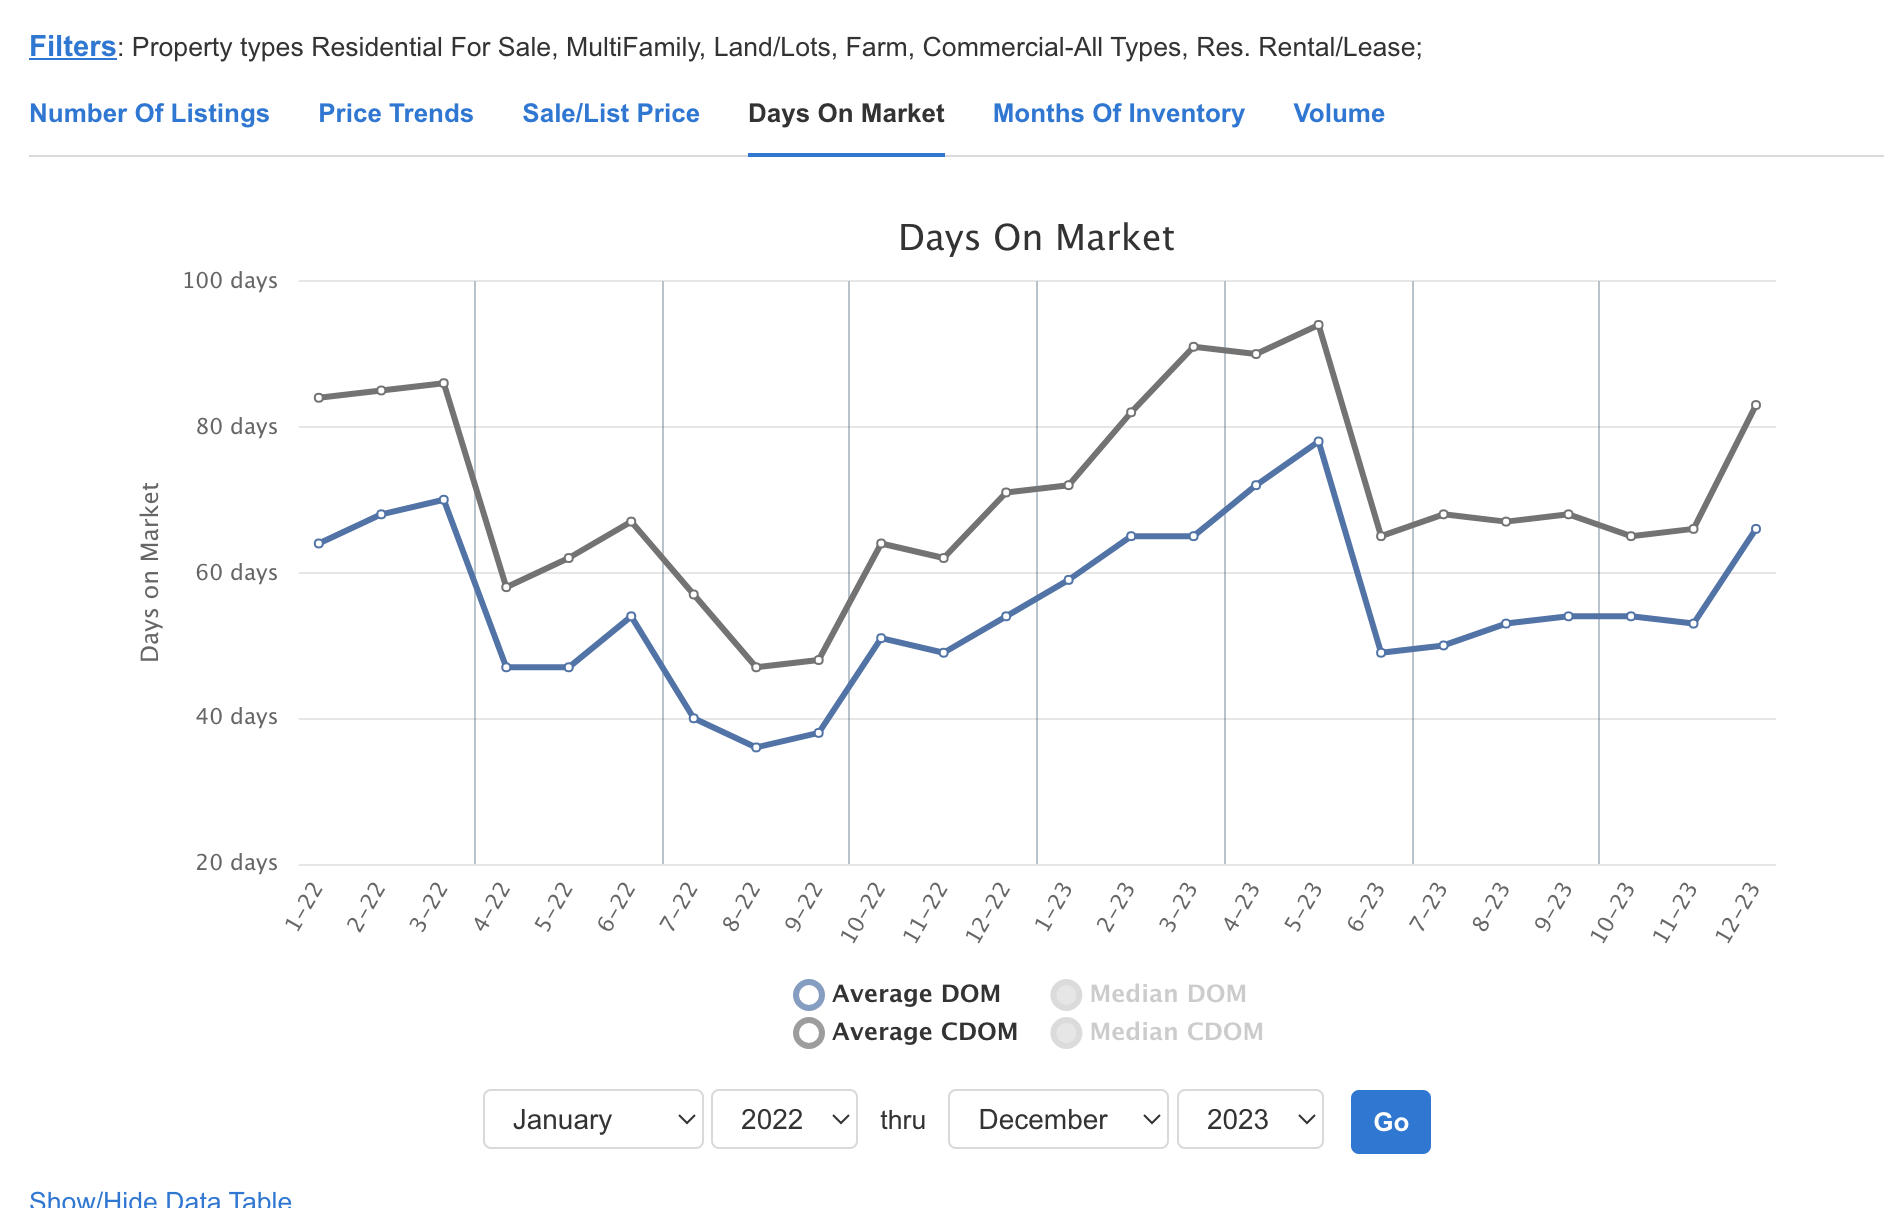
Days on Market
There are two terms that are brought up when discussing Days on Market. There is Days on Market and Continuous Days on Market. Days on Market measures the time a listing hits the market to the time it goes under contract. Usually there is a month or so between a contract and closing day. The Continuous Days on Market Measures the time from listing to the time of closing. CDOM will be more than DOM.
Year over Year Comparison
2022, we averaged 52 days on the market while 2023 went up to 60 days on the market.
Quarterly Comparison
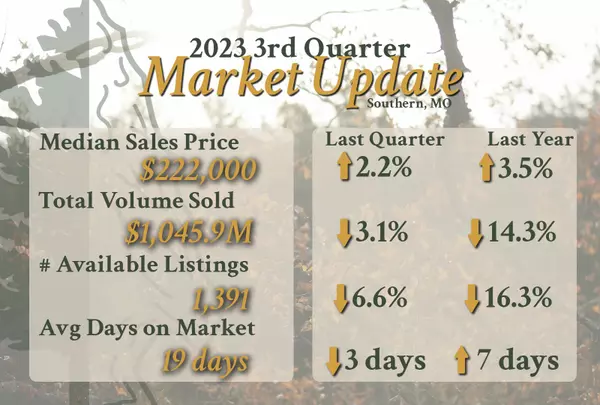
2023, 3rd quarter averaged 52 days on the market and 4th quarter hit 58 days on the market, a 6 day increase. 2022 q3 to q4 jumped from 38 to 51 days on the market, a 13 day increase.
Categories
Recent Posts