June 2024 Market Update

Southern Missouri June Market Update
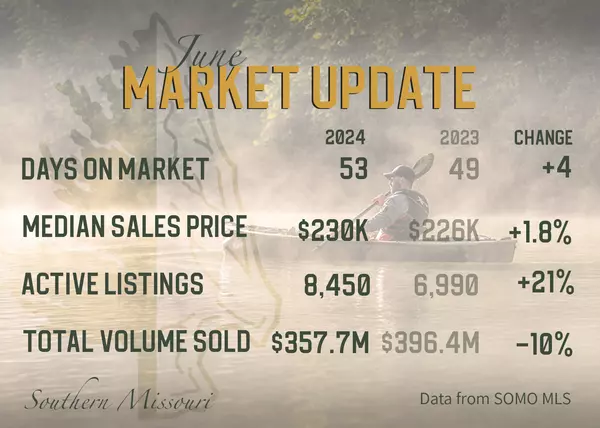
The graphic above compares June 2024 to last June for all property types and locations within the Southern Missouri MLS. We take a rather broad perspective on the market; however, if you want details on specific property types, counties, etc., please let us know! Maria can spend hours pouring over data and trying to find patterns and trends.
In quick summary, our days on the market (days from listing to securing a contract) is up 4 days, median sales price is up by almost 2%, we have 21% more listings but are down 10% in total sales volume.
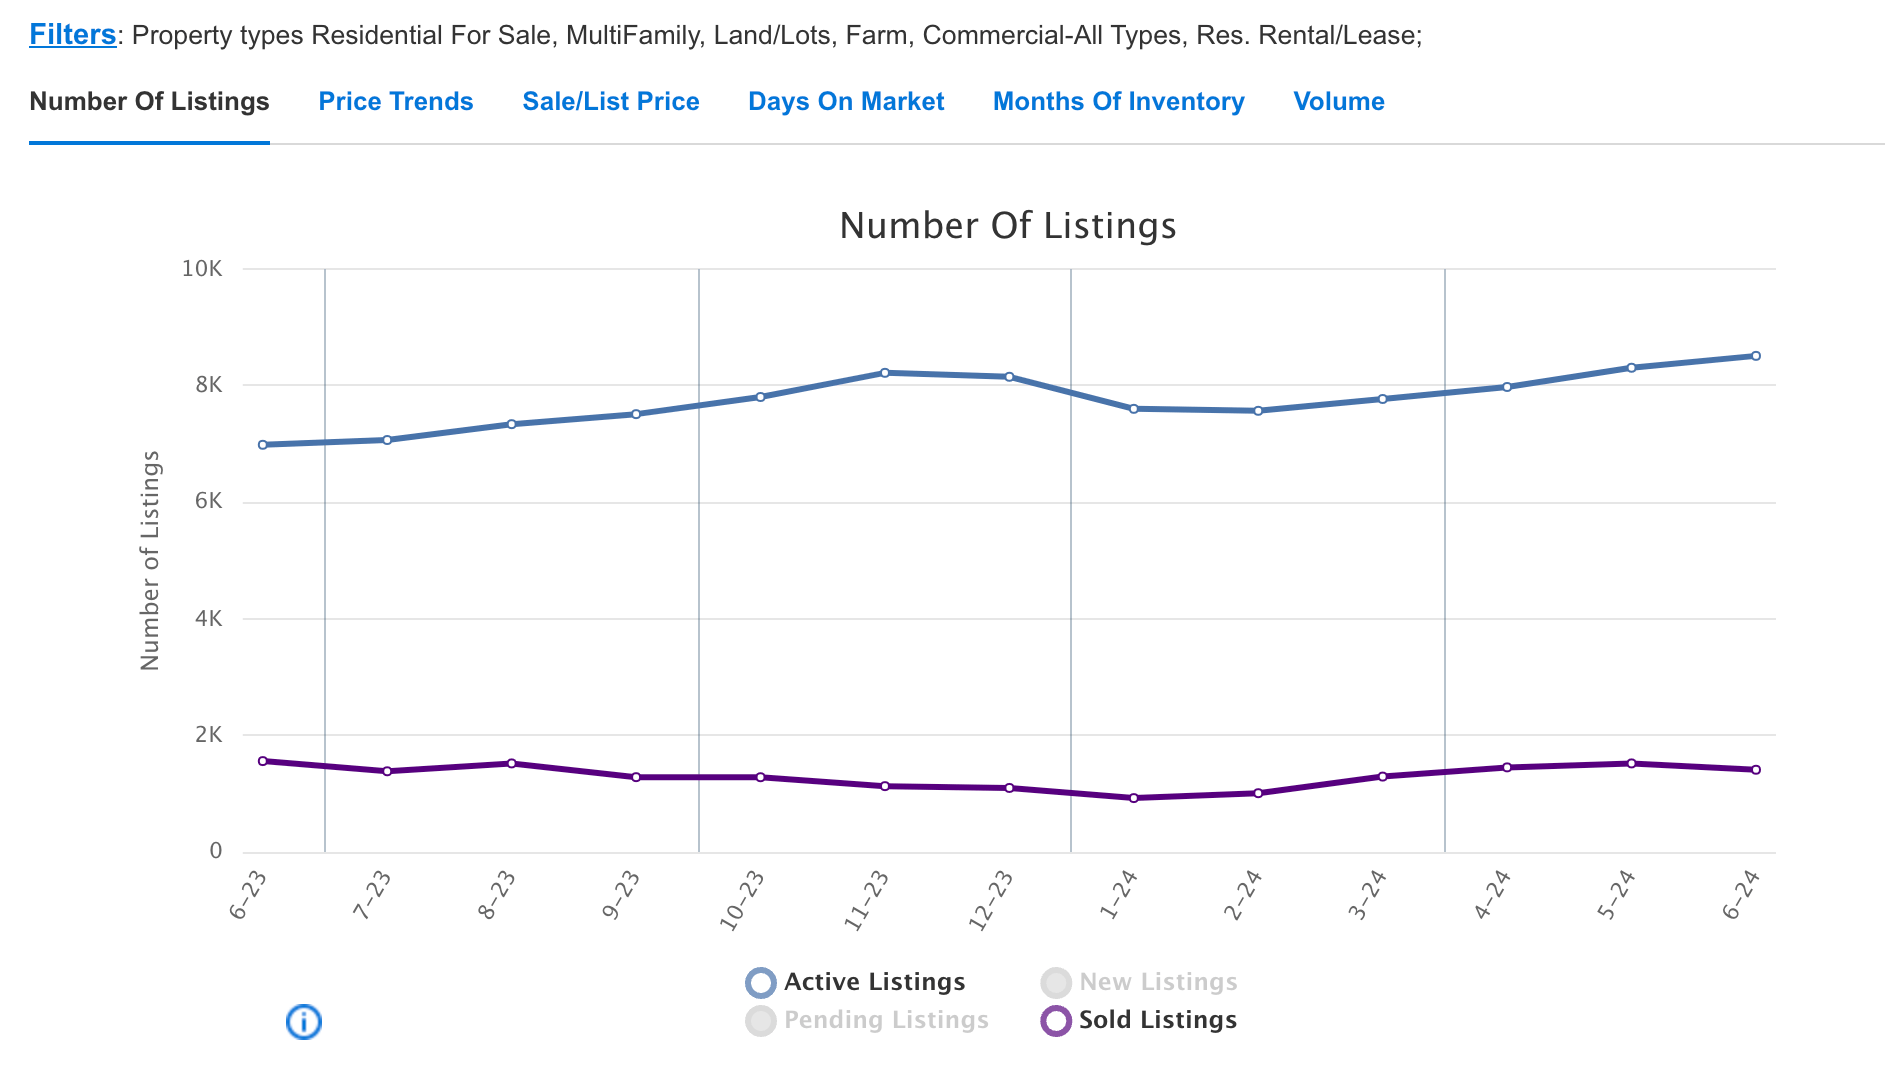
As you can see above, we have had an increase in active listings with a slight decrease in sold listings 1.56k sold in June 2023 vs 1.41k sold in 2024.
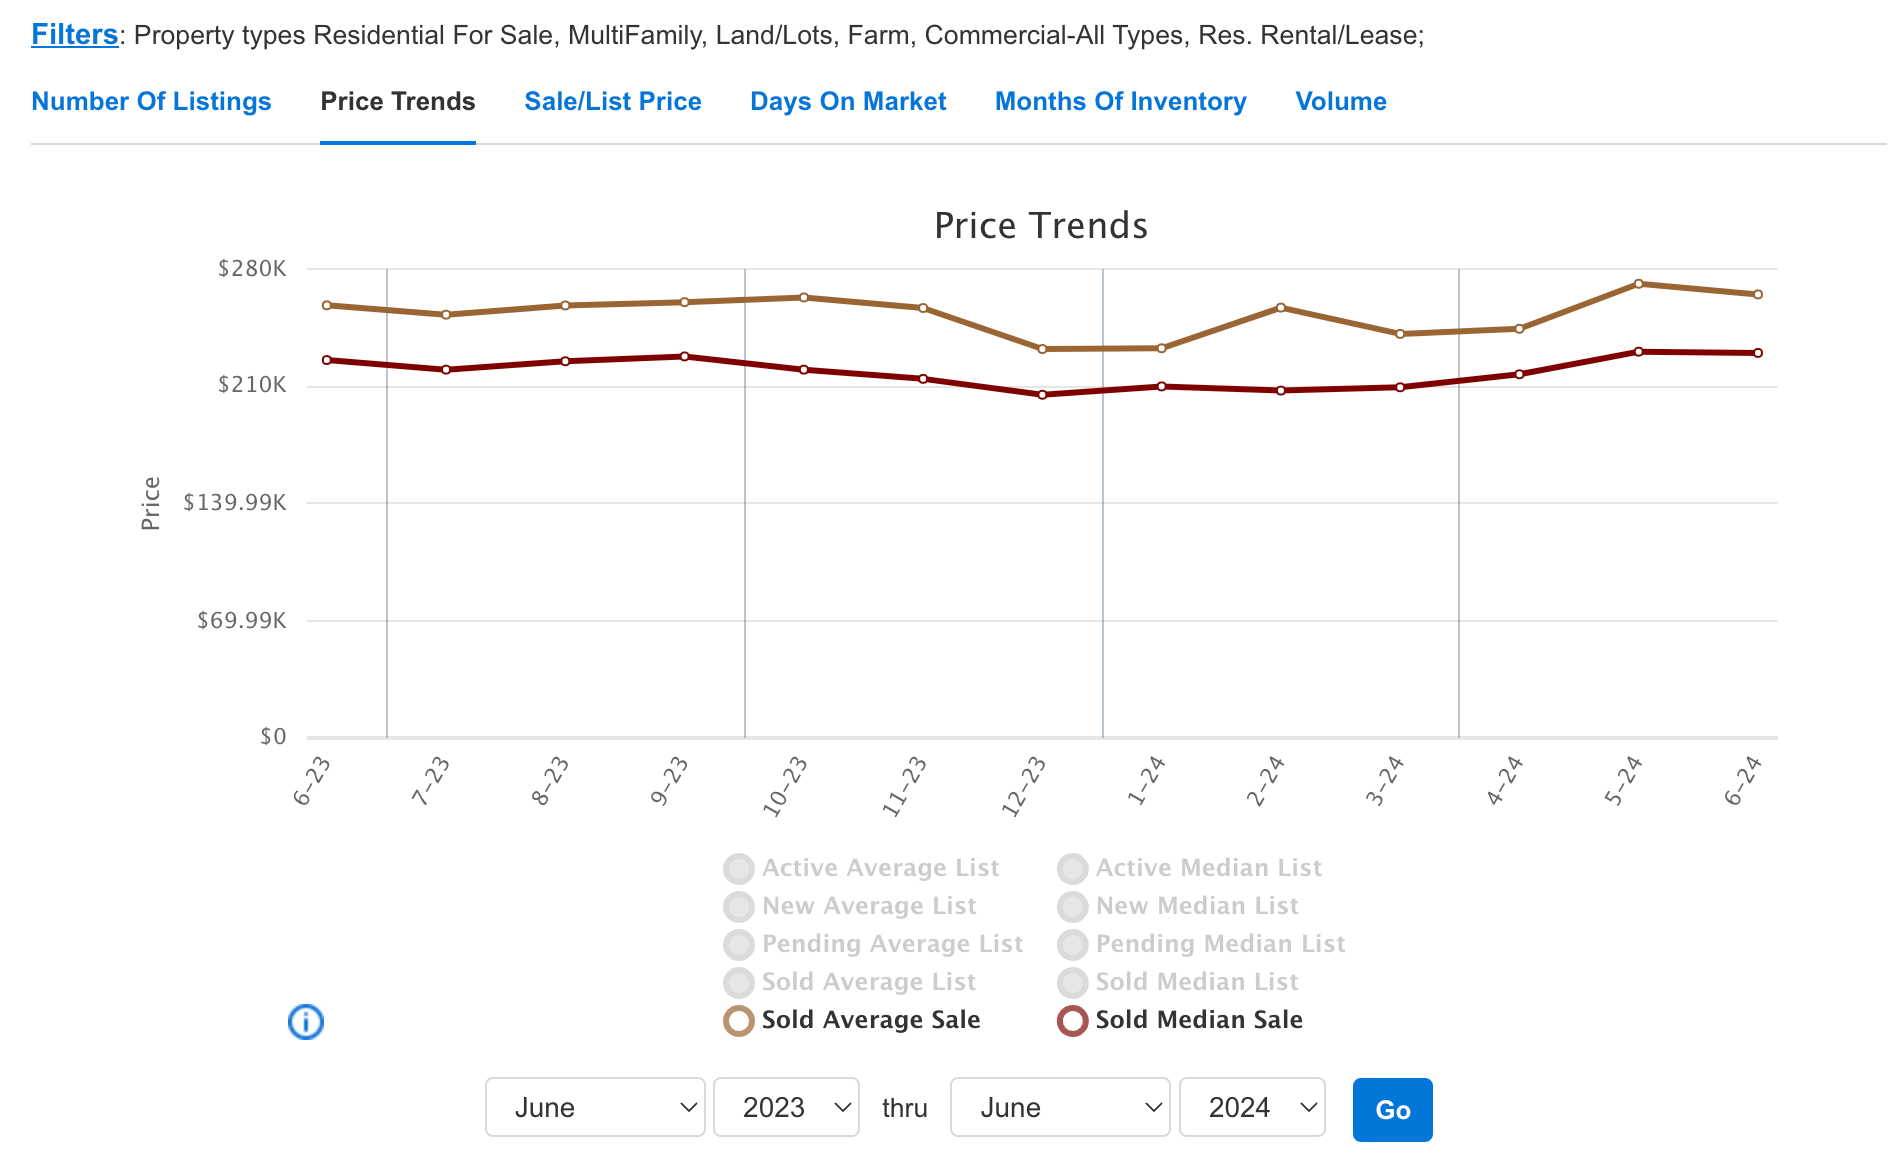
Over the last year, our prices (and units sold) gradually dipped in the winter, but we are up 1.8% in median price and 2.5% in average sale price.
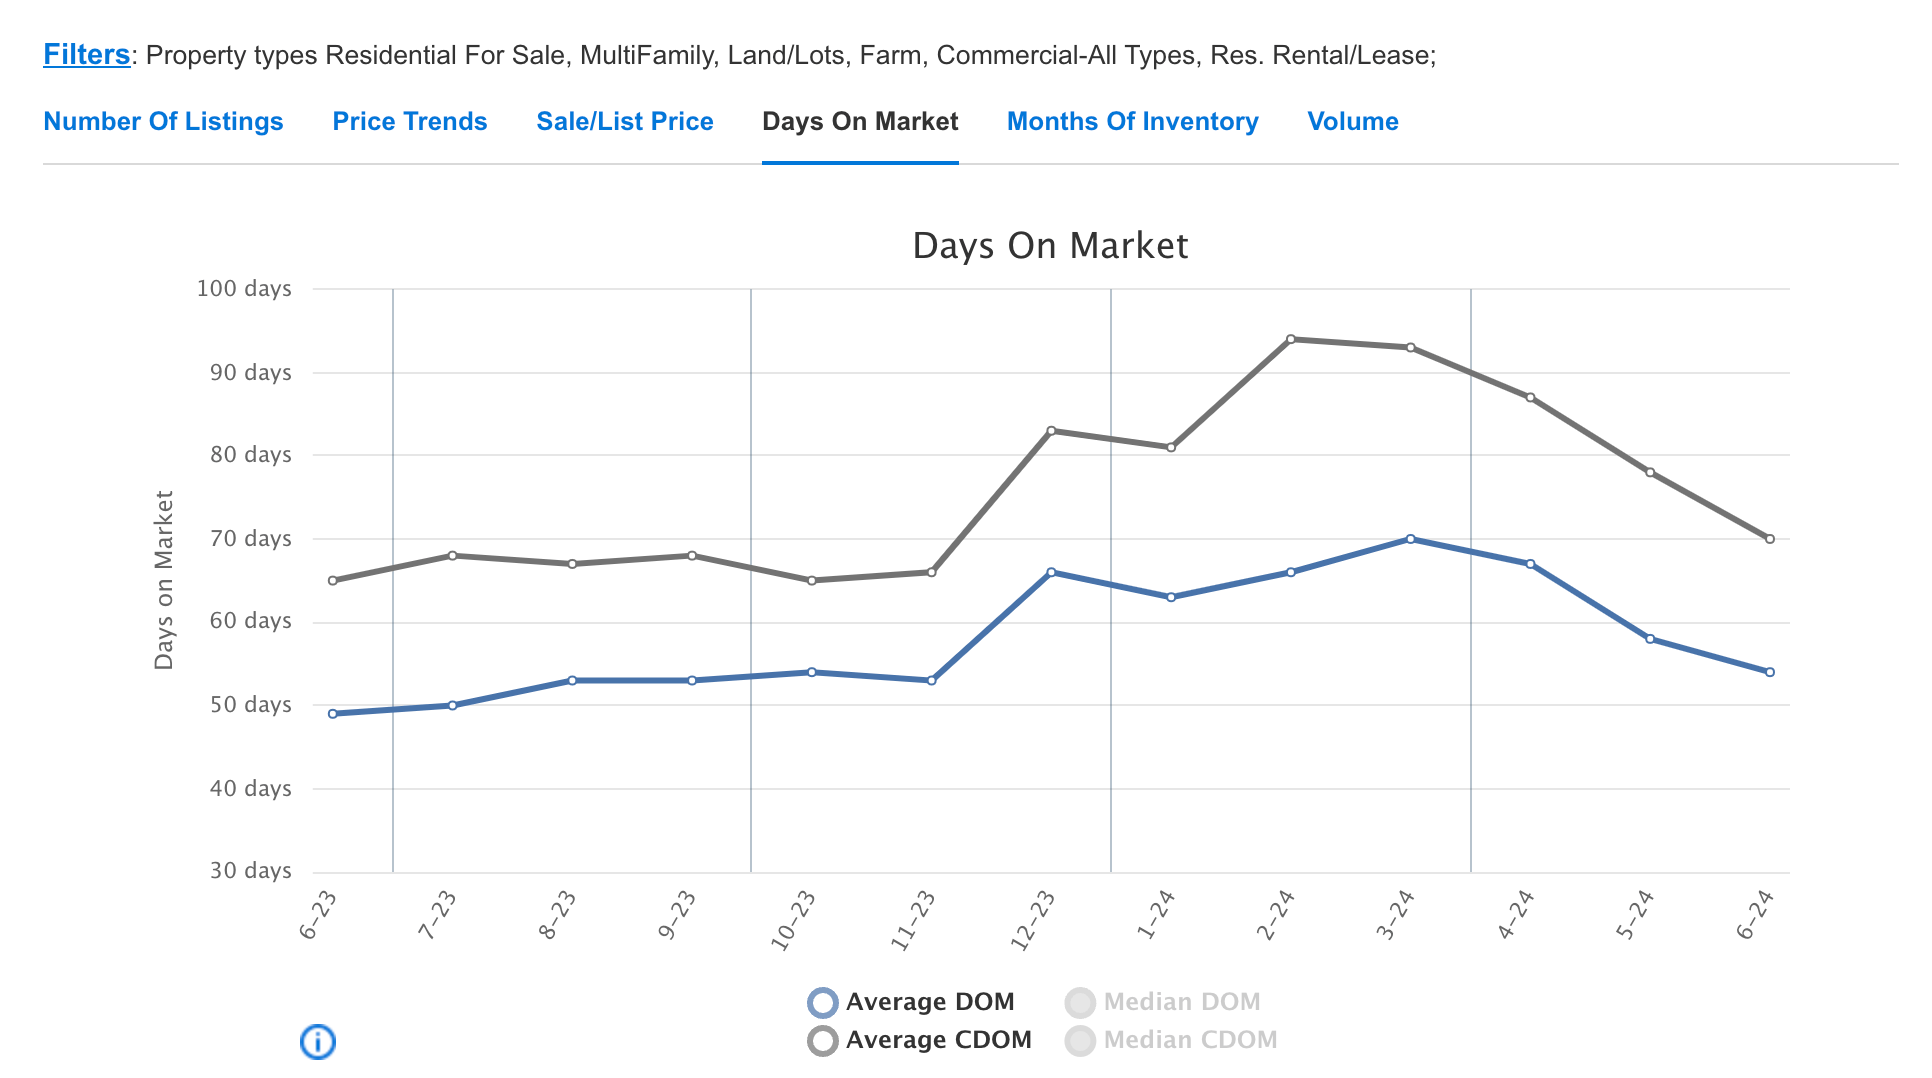
We had a big leap in days on market over the winter and early spring as the rates were increasing, but they are coming back down. DOM is the time from listing to contract where CDOM is the total time on the market to closing day.
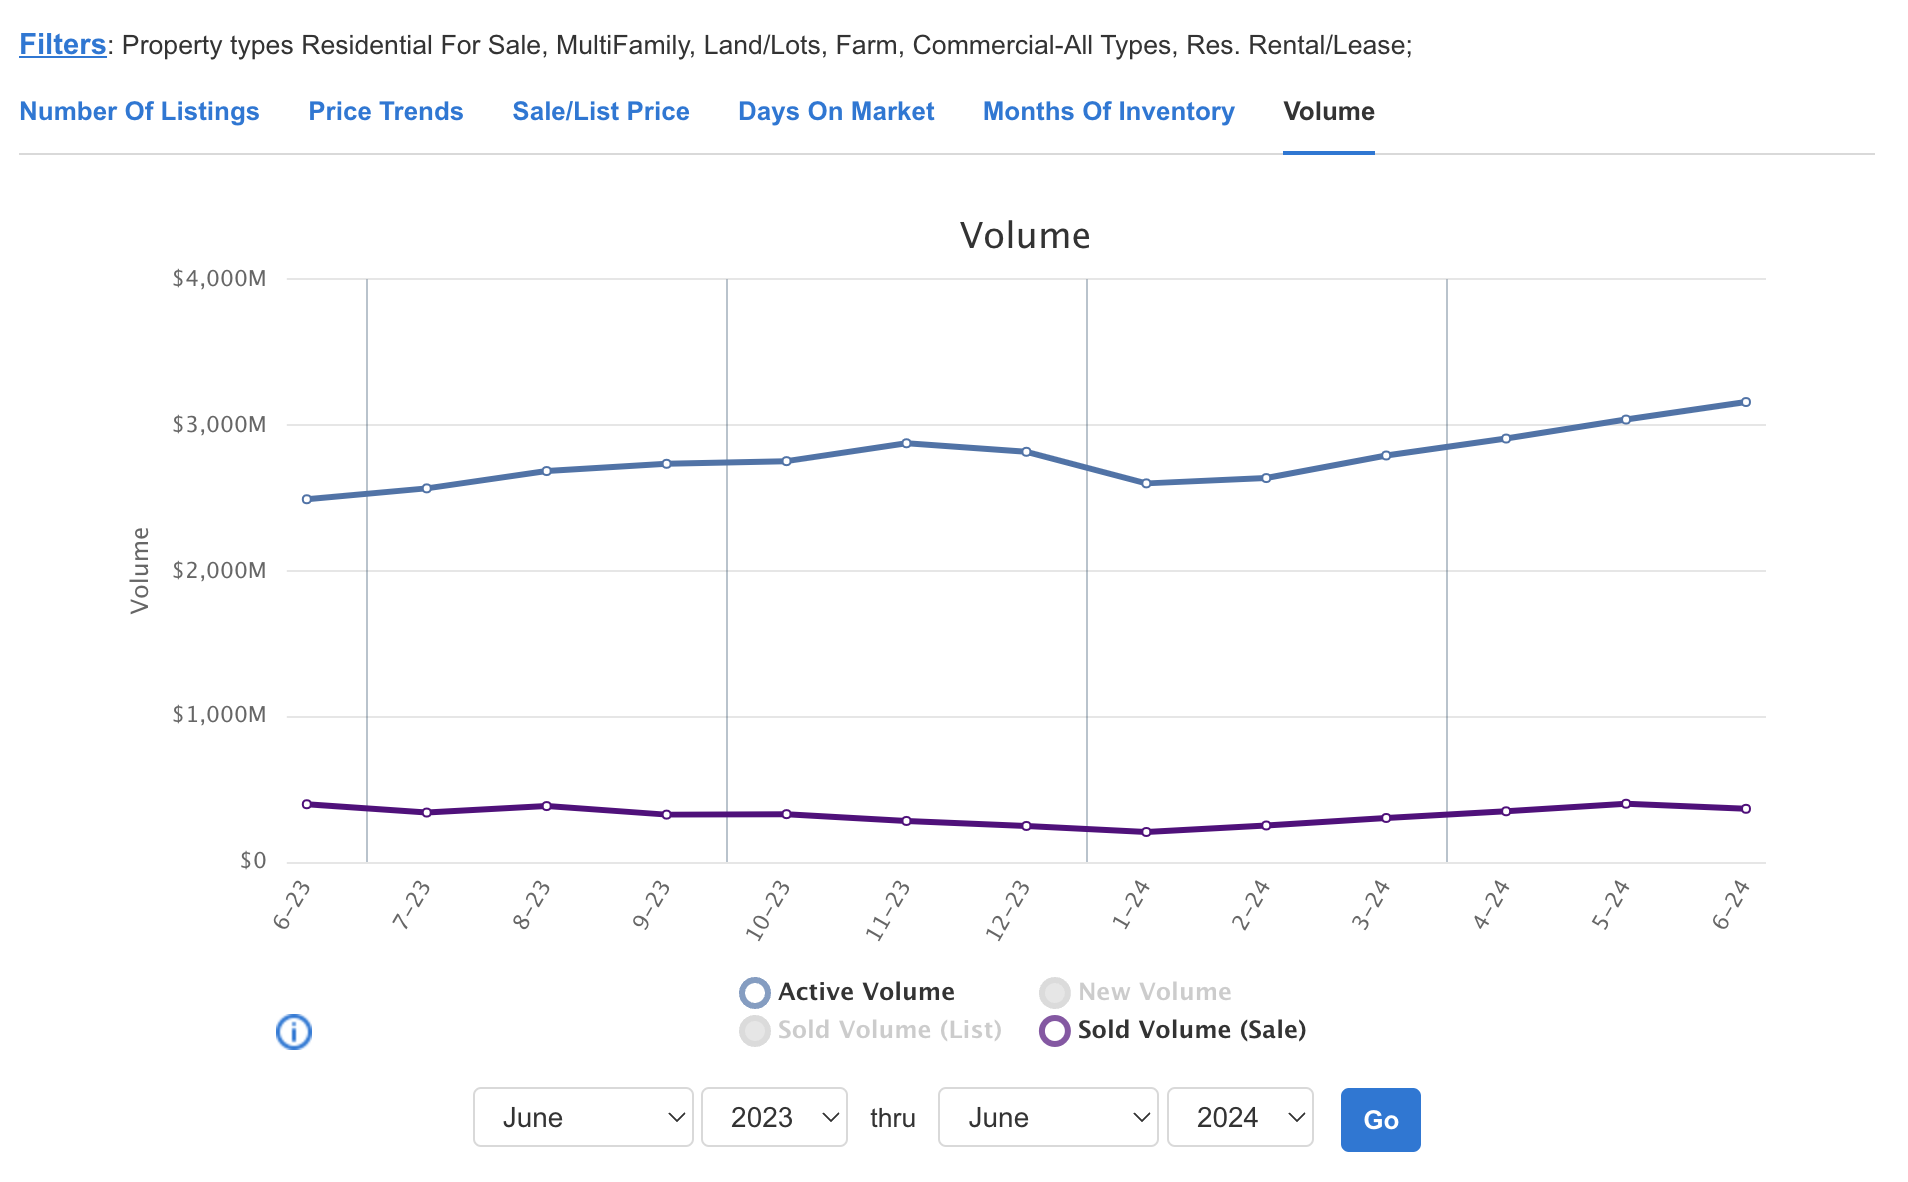
Finally, our volume on the market is increasing while the amount sold is rather level.
We have to admit that this isn't a very exciting market update, but a healthy one in our opinion! We have needed our inventory to increase and we like to see the slower, steadier price increase. Some property types are still flying off the market where others seem to sit longer than we were used to in the Covid period.
Categories
Recent Posts

Discover Your Dream Homestead at 25785 US Highway 160, Gainesville, MO

Charming New Home on 4.5 Acres in the Heart of the Ozarks

Discover Your Private Wilderness Retreat: 155 Acres of Seclusion and Natural Beauty in Dora, MO
2024 Year End Market Update
June 2024 Market Update
2023 Year End Market Update - Southern MO
2023 Third Quarter Market Update

About Mountain Grove

Preparing Your Home for Winter

What Southern MO Towns Allow Livestock?

