2024 Year End Market Update

2024 Year End Real Estate Market Update for Southern MO
I cannot believe we have another year behind us. I always enjoy looking at our stats each month but it is always interesting to see the trends when the year actually comes to a close. I'm especially enjoying writing this year's update being snowed in, watching the birds peck at seed out the window, stoking the fire, and baking bread.
But, let's get to it... To summarize, we have seen great growth, but it has taken longer to secure contracts and close on a property.
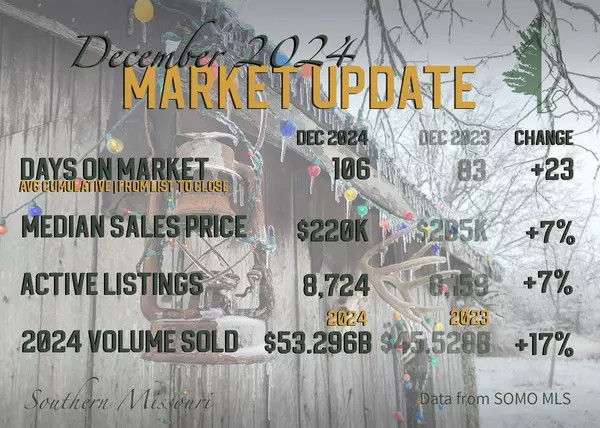
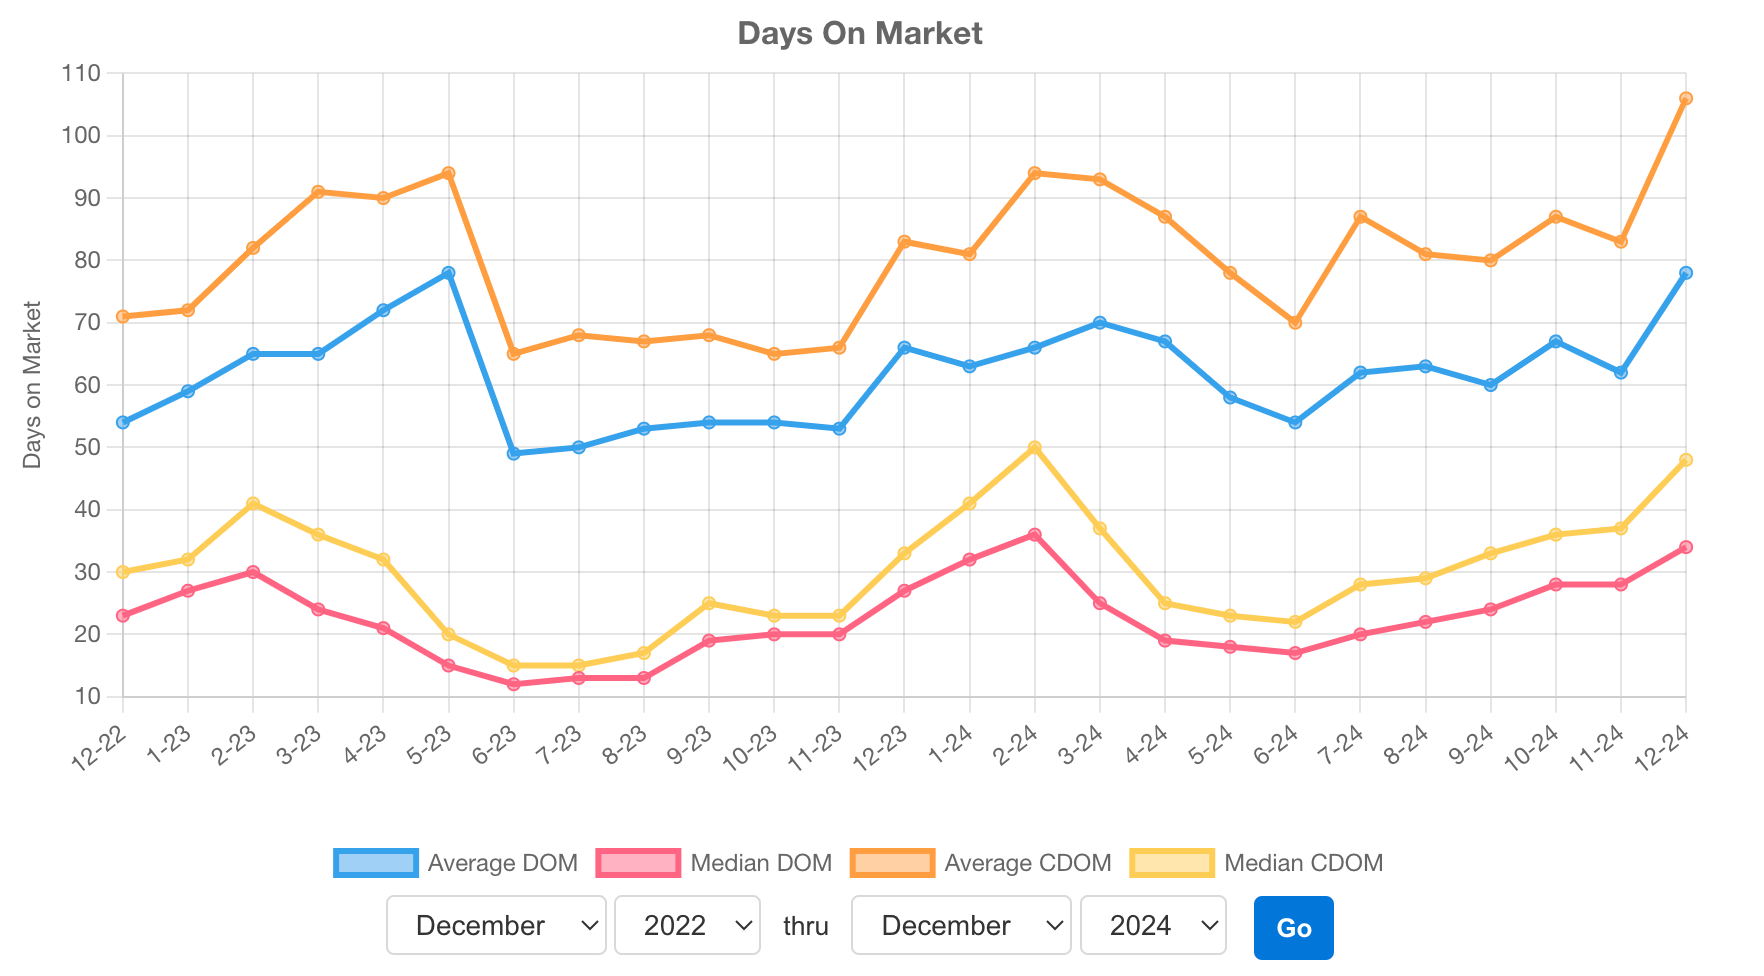
Days on Market
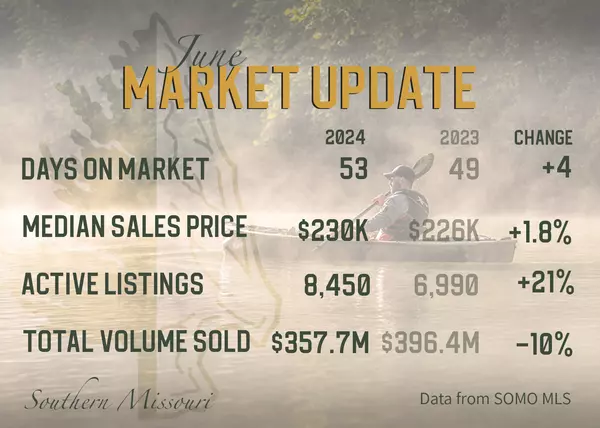
Last December, we averaged 83 days on the market: from the date of listing to the date of closing. This December, we jumped 23 days to 106 days on the market: 3.5 months! Our lowest average days on the market was June: 54 days. The median days on the market was 48 days. Since the area we service is more rural with unique features with the land and homes, I believe the average (not median) is the best way to set expectations when listing your property.
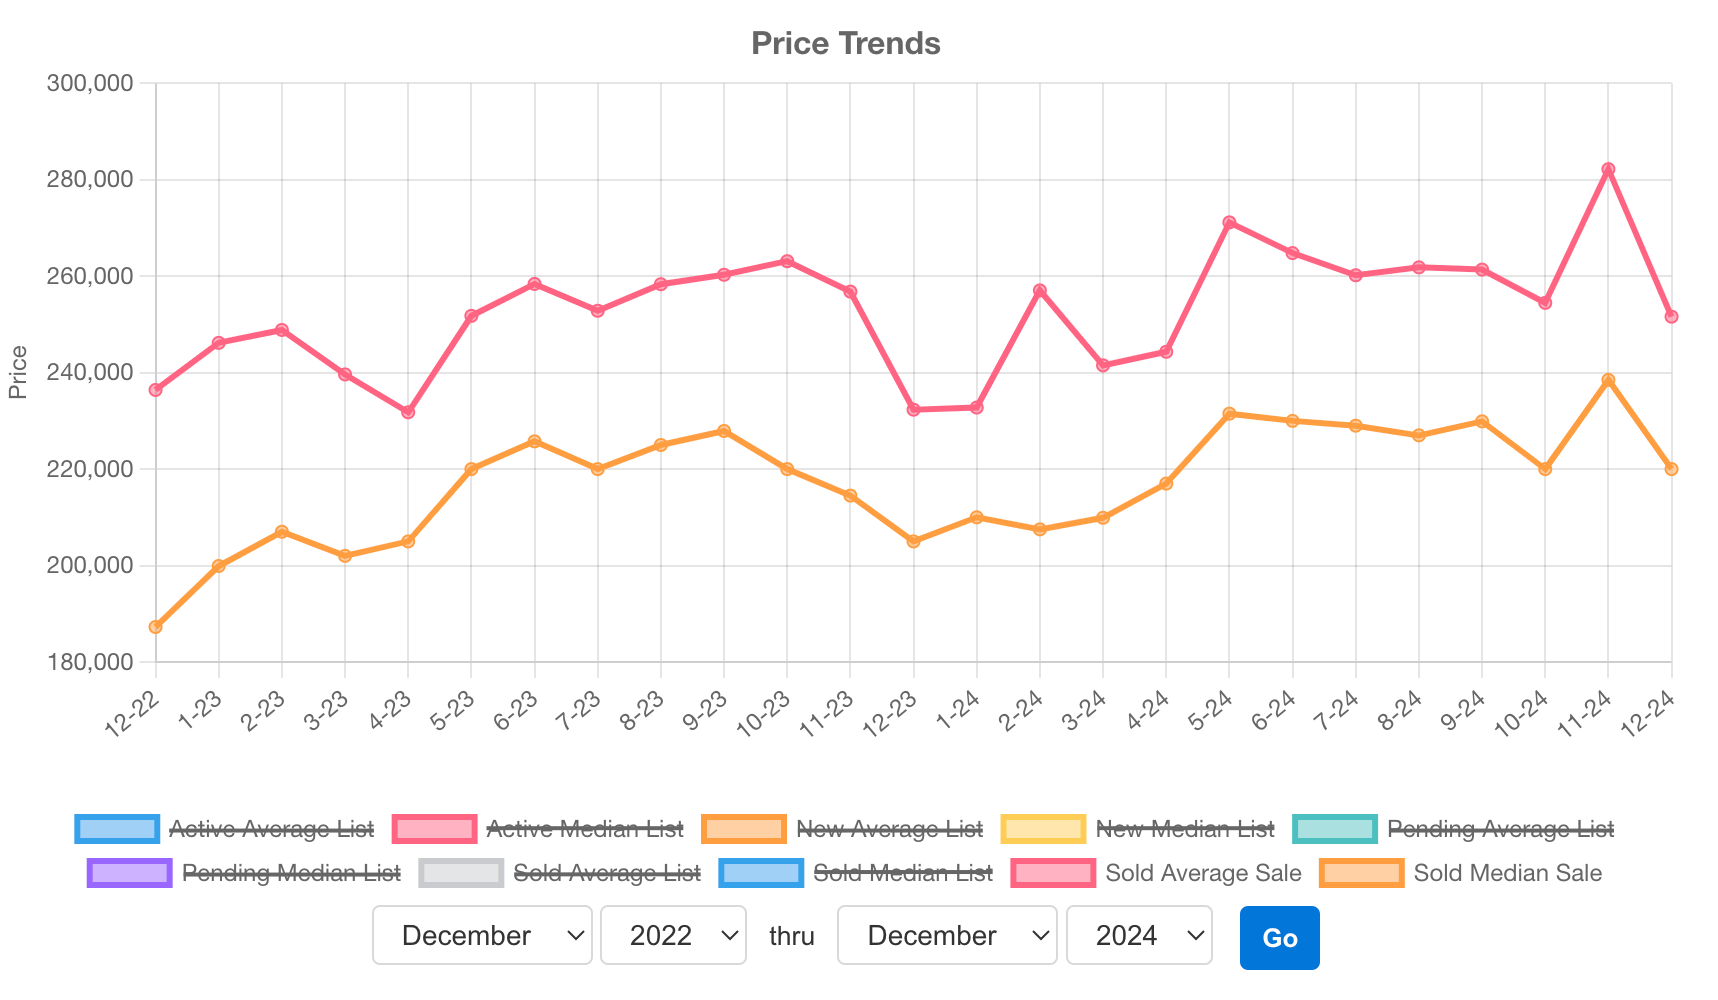
Sales Price
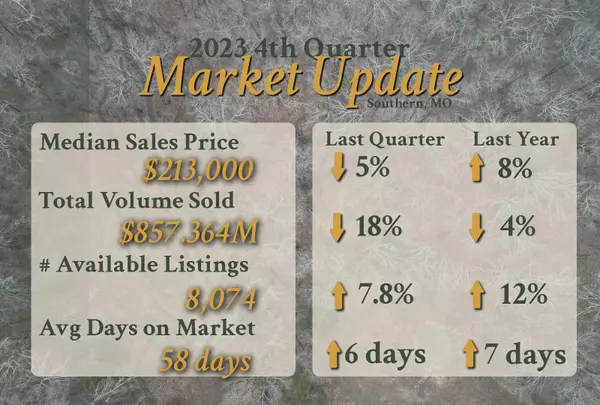
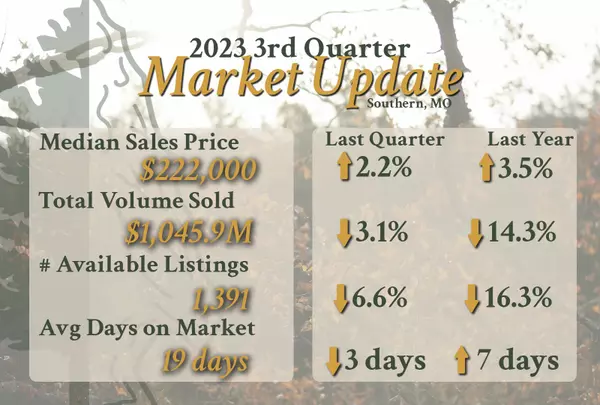
We calculated both median and average sales price increase. Median: +7%, Average +8% from December 2023, so pretty close. Our December Median Sales Price was $220,000 while the average was nearly $252,000. Remember, this includes farms, commercial, AND homes in town. Note that 2023 September/October's Median/Average Sales price exceeded our December 2024 Sale Price by 4%. When comparing month to month, the growth looks to be improving, but looking at the actual graphs, you can see big fluxuation! However, when looking at trends and seeing the increase in summer to early fall with decreases in the winter, our general trend is still moving upwards.
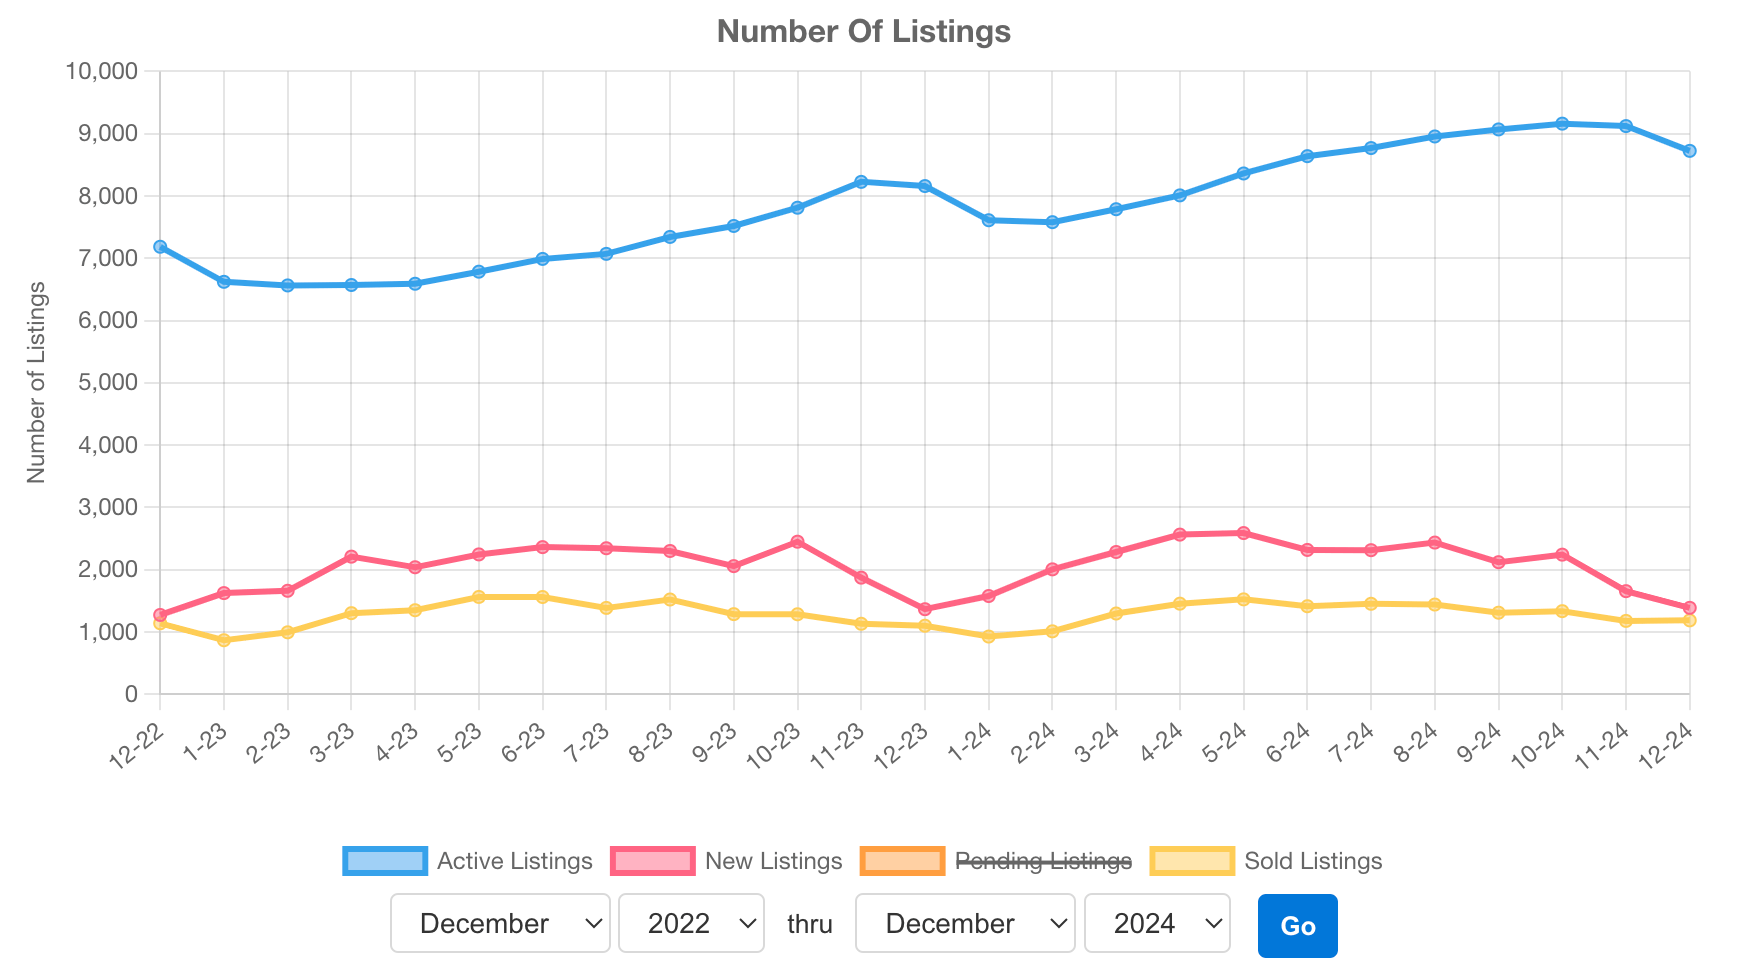
Number of Listings
There has been a 7% increase in active listings. The available listings frequently follows a similar trend. The number picks up in late spring and builds through November with it beginning to drop again in Decamber.
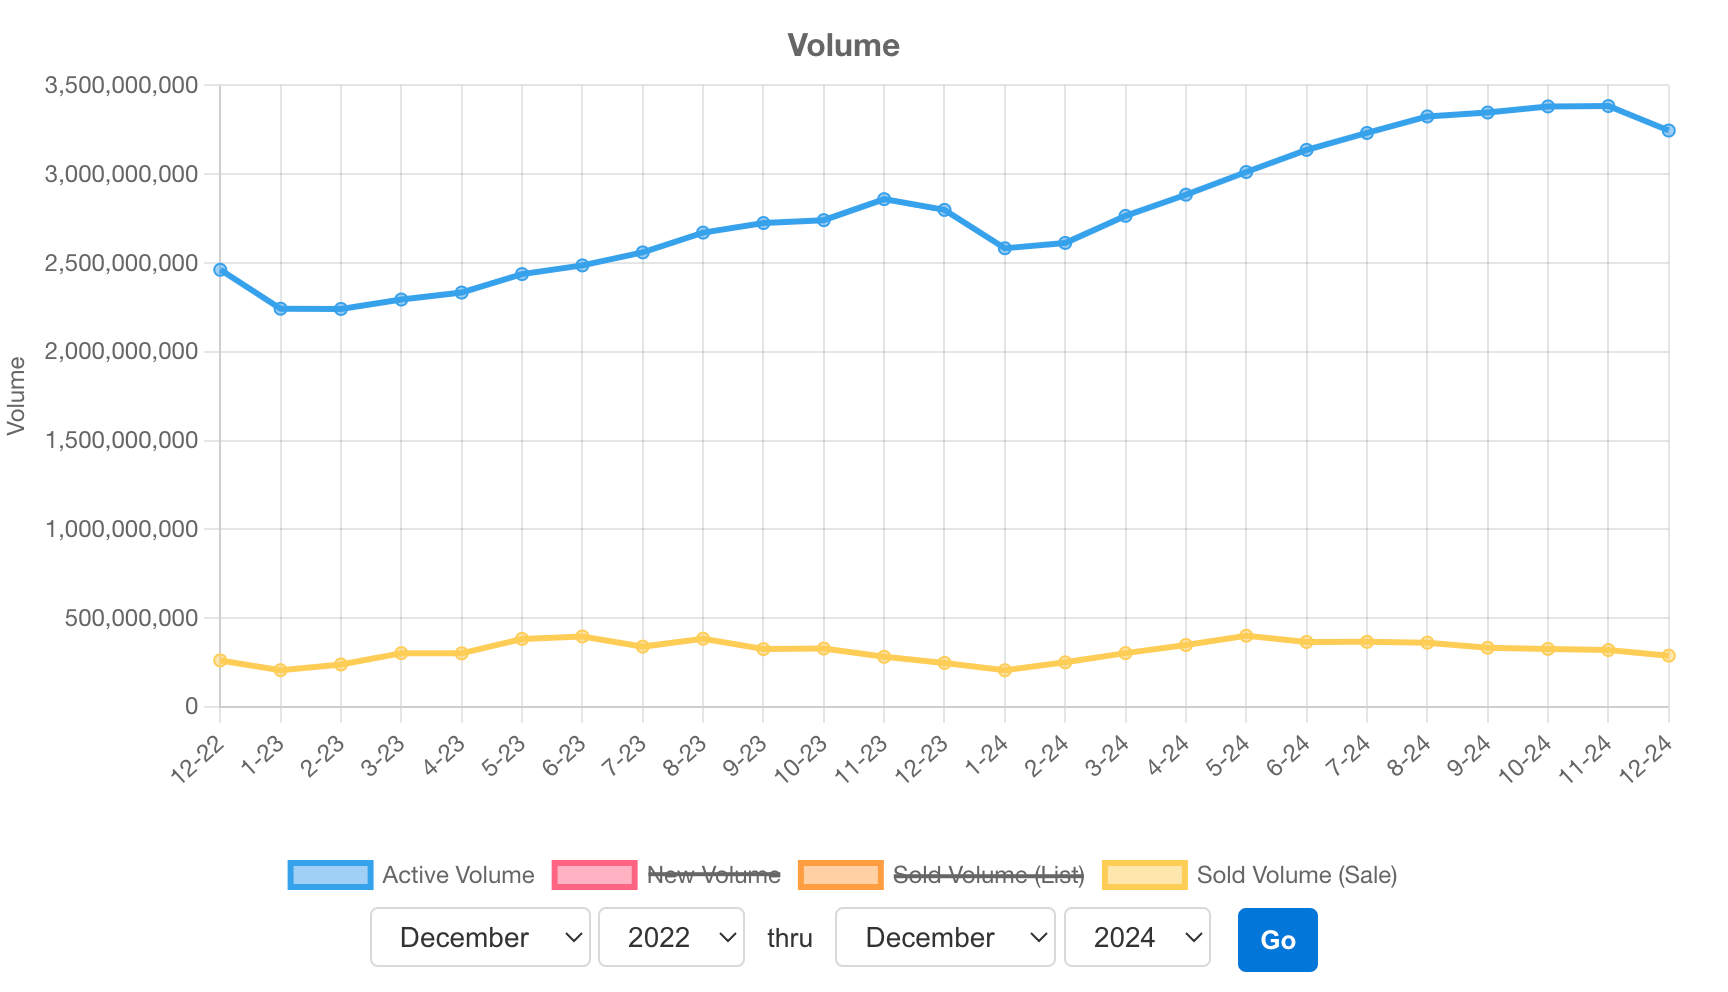
Sales Volume
We had a total Sales Volume increase of 17% compared to 2023! Comparing December 2023 to December 2024, we are up 15%. I have to admit... that most definitely exceeded my expectations.
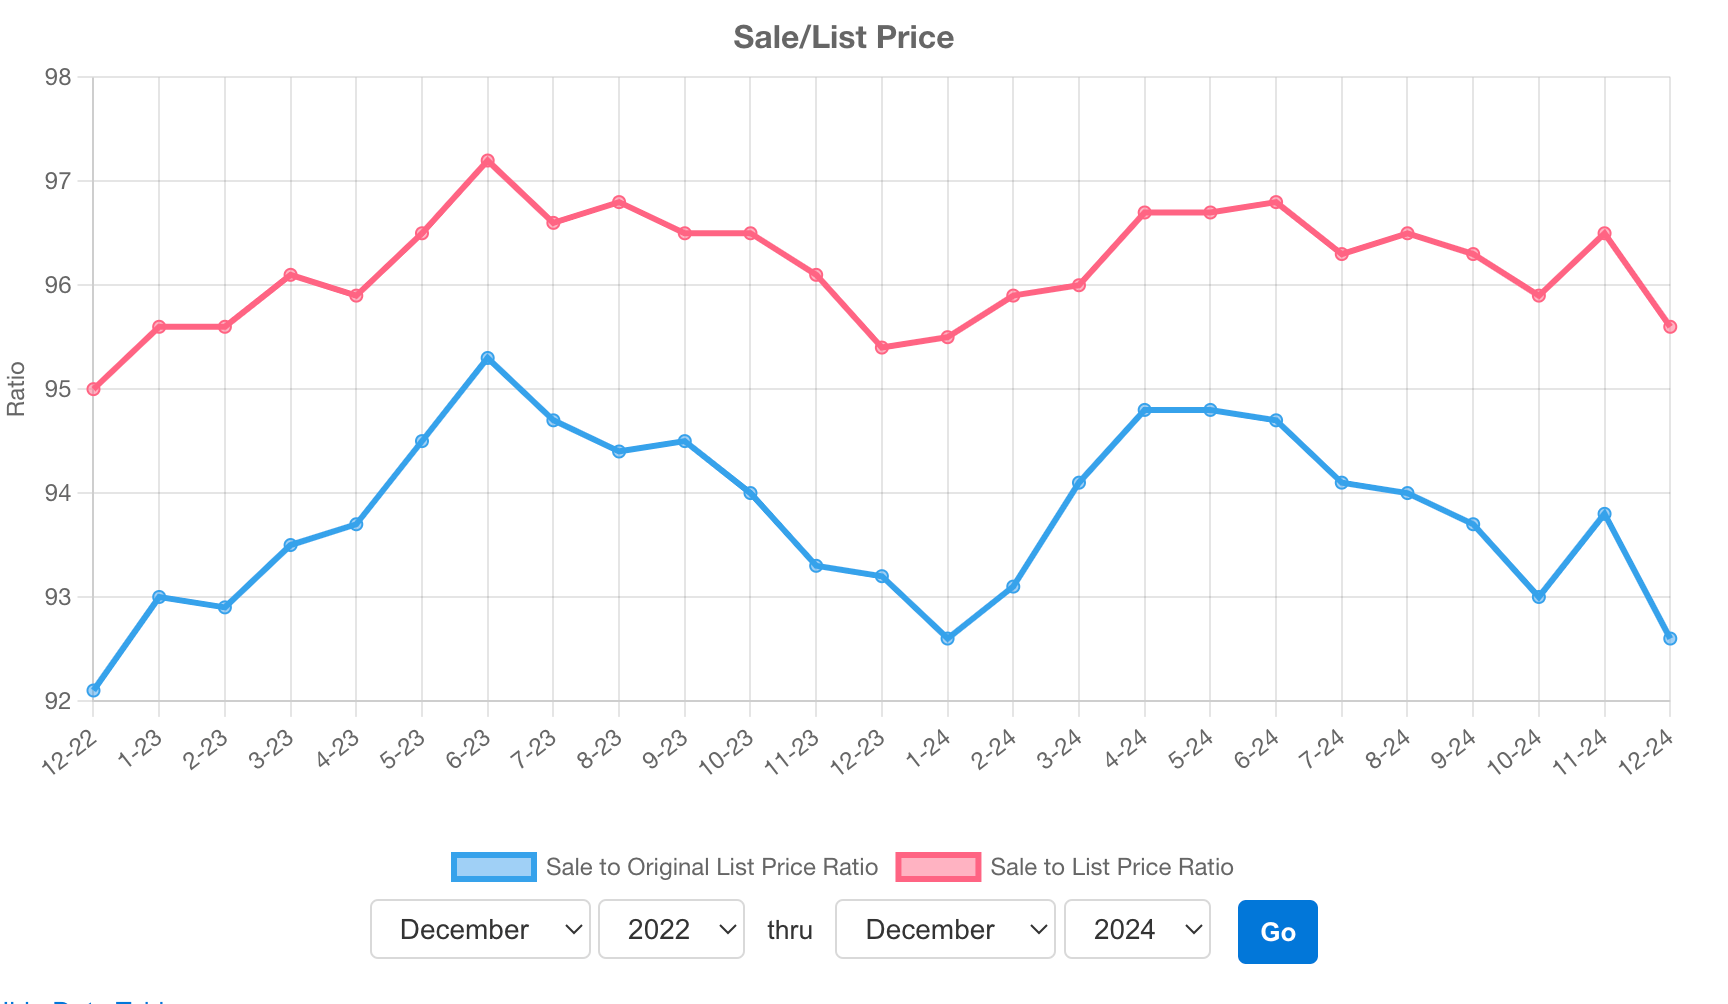
Sales to List Price Ratio
Finally, the comparison of sales price to current listing price and original listing price. During the summer months, sellers were getting closer to their list price while there was a larger gap during the winter. This graph shows that many properties saw at least one price reduction before actually selling.
Any further questions, reach out!
Maria Lawler
Categories
Recent Posts