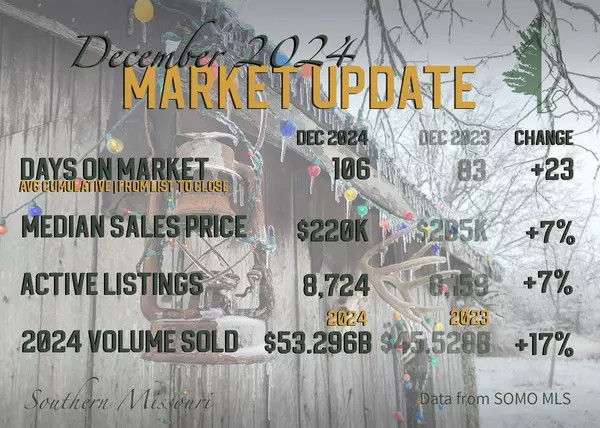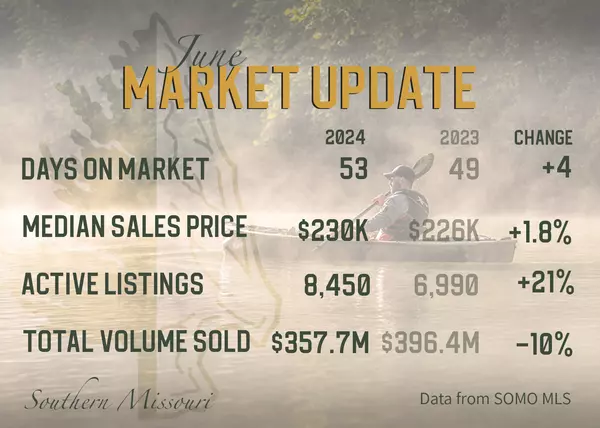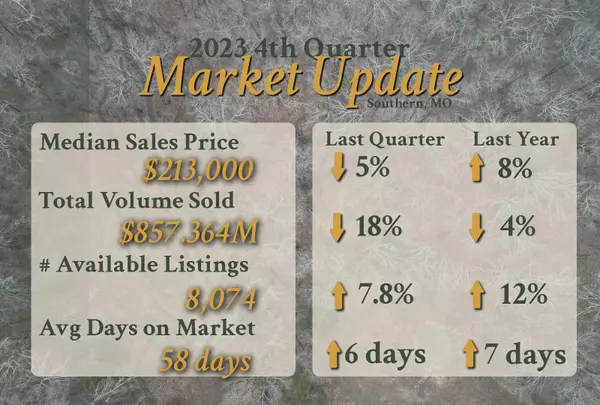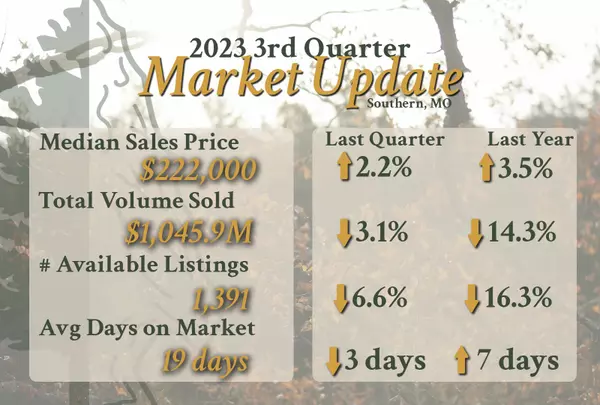
June 2023 Market Update
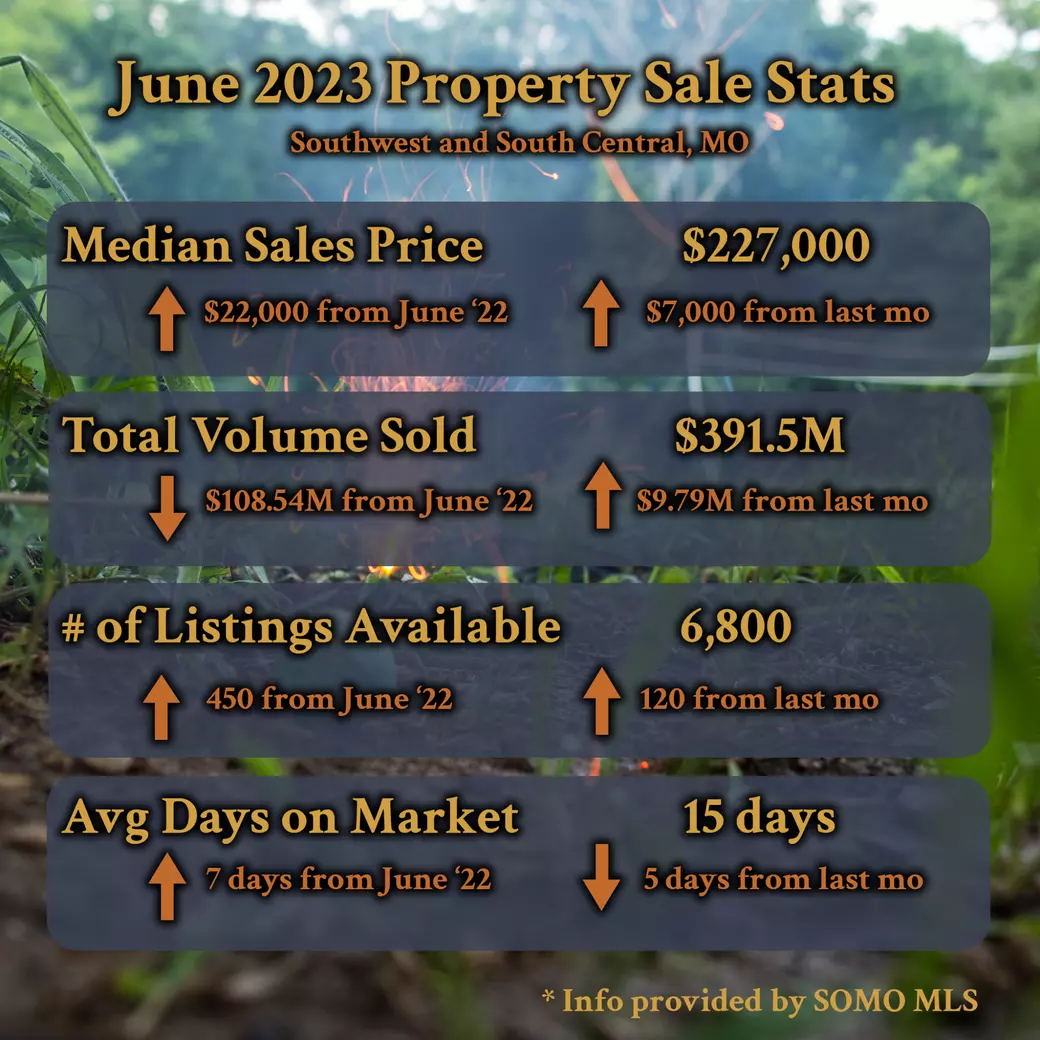
The numbers are in! Immediately below, you can see a summary of the numbers provided by SOMO MLS, which covers all of SW and South Central, Missouri. Further below, I provide graphs on the details.
In the last year, the median sales price is up from last month and June last year. The total volume sold is down from last year but up from last month. Inventory is slowly increasing. More inventory is great for buyers as there will be fewer multiple-offer situations and more to choose from, and less ideal for sellers due to increased competition. However, these numbers aren't enough to make it easier or harder for buyers or sellers. These numbers are for a wide area and broad property types, so that little 450 listing increase isn't very much when considering our MLS's spread. When we first joined this MLS in 2017, there were roughly 14,000 listings available (including Springfield). We are now less than half of that. Even though the numbers are climbing, only a much more considerable increase will really change the market. Our days on the market are roughly 15 days before seeing a contract. When you look at the more rural counties, the DOM is closer to 22-30 before going under contract.

The graph below compares the number of listings available and the number of listings actually sold in the last year.

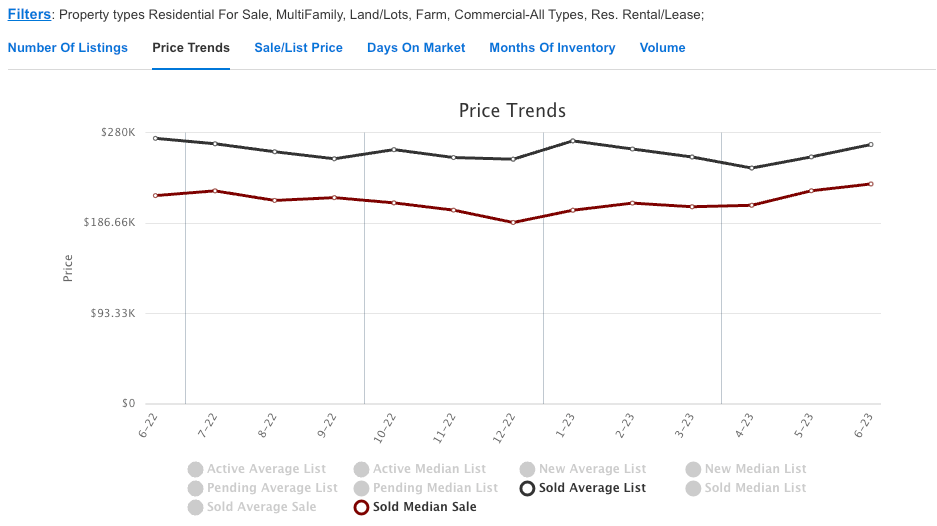
The Price Trends graphy below is interesting. Our median sales price is up $22,000, but the average is very close to where we were last year.
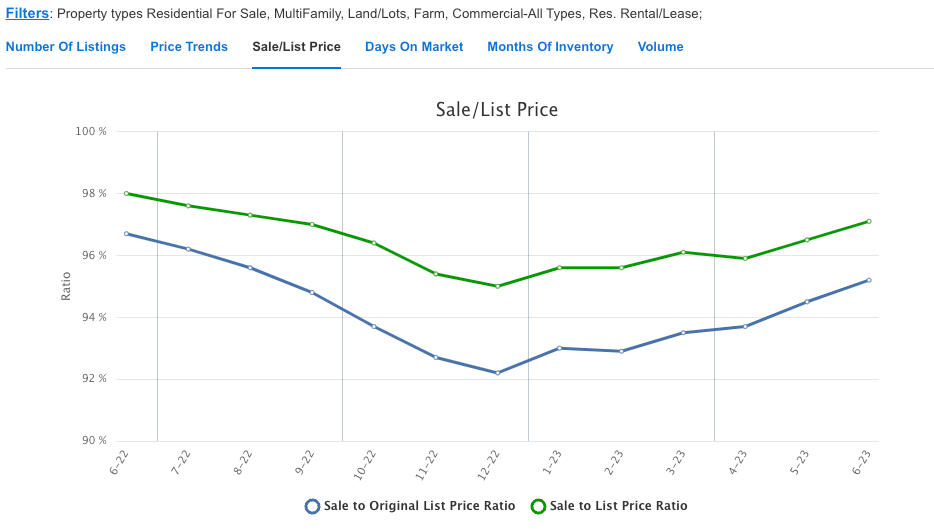
Last year, sellers were getting 98% of their asking price. Sellers were accepting 95% of their list price 6 months ago, but that is climbing back to 97%. I believe that after the Covid Purchase Frenzy, sellers were used to asking for excessive amounts in hopes to get them like they once were. However, with the market regulating, sellers may be understanding our current market and not adding so much "fluff" to their listing price. Just in seeing the gap between the Sale to List Price ratio between original list price and current list price demonstrates the sellers' listing reductions.
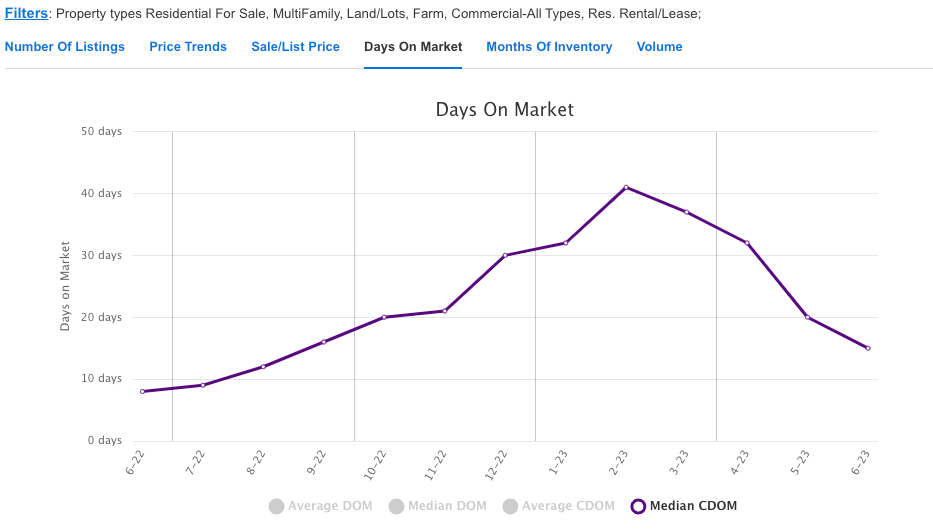
With that, the days on the market had a hike when all the sellers listed higher than they should. With their expectations becoming more realistic, the days on the market are also decreasing.
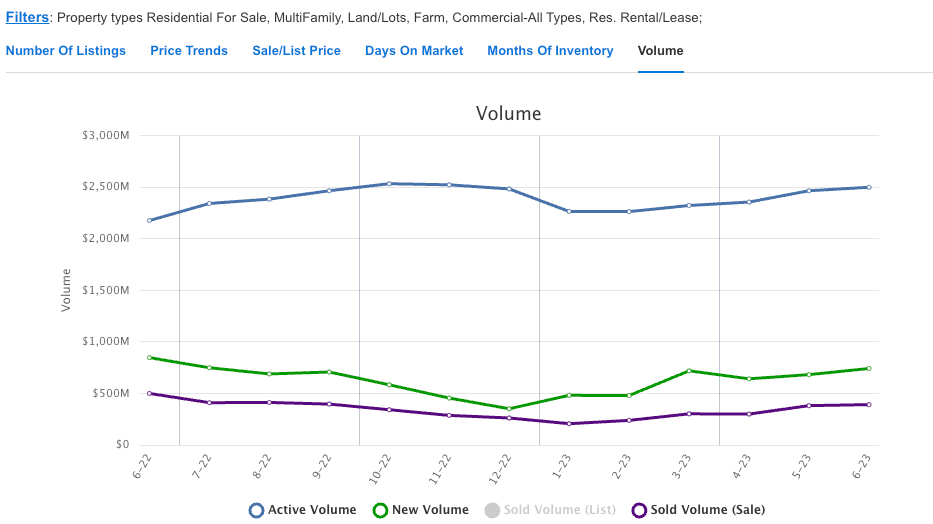
Finally, the volume. We have more listings coming to the market than we are selling which is increasing our inventory. There is currently nearly $2.5B listed in the area where last year was roughly $2.2B
I hope this is helpful in understanding our current area market! As always, I am happy to break this down and interpret it to your situation, location, and property type. The engineer in me really enjoys checking out the stats.
Categories
Recent Posts